3D Printing the Environment Agency LIDAR Data

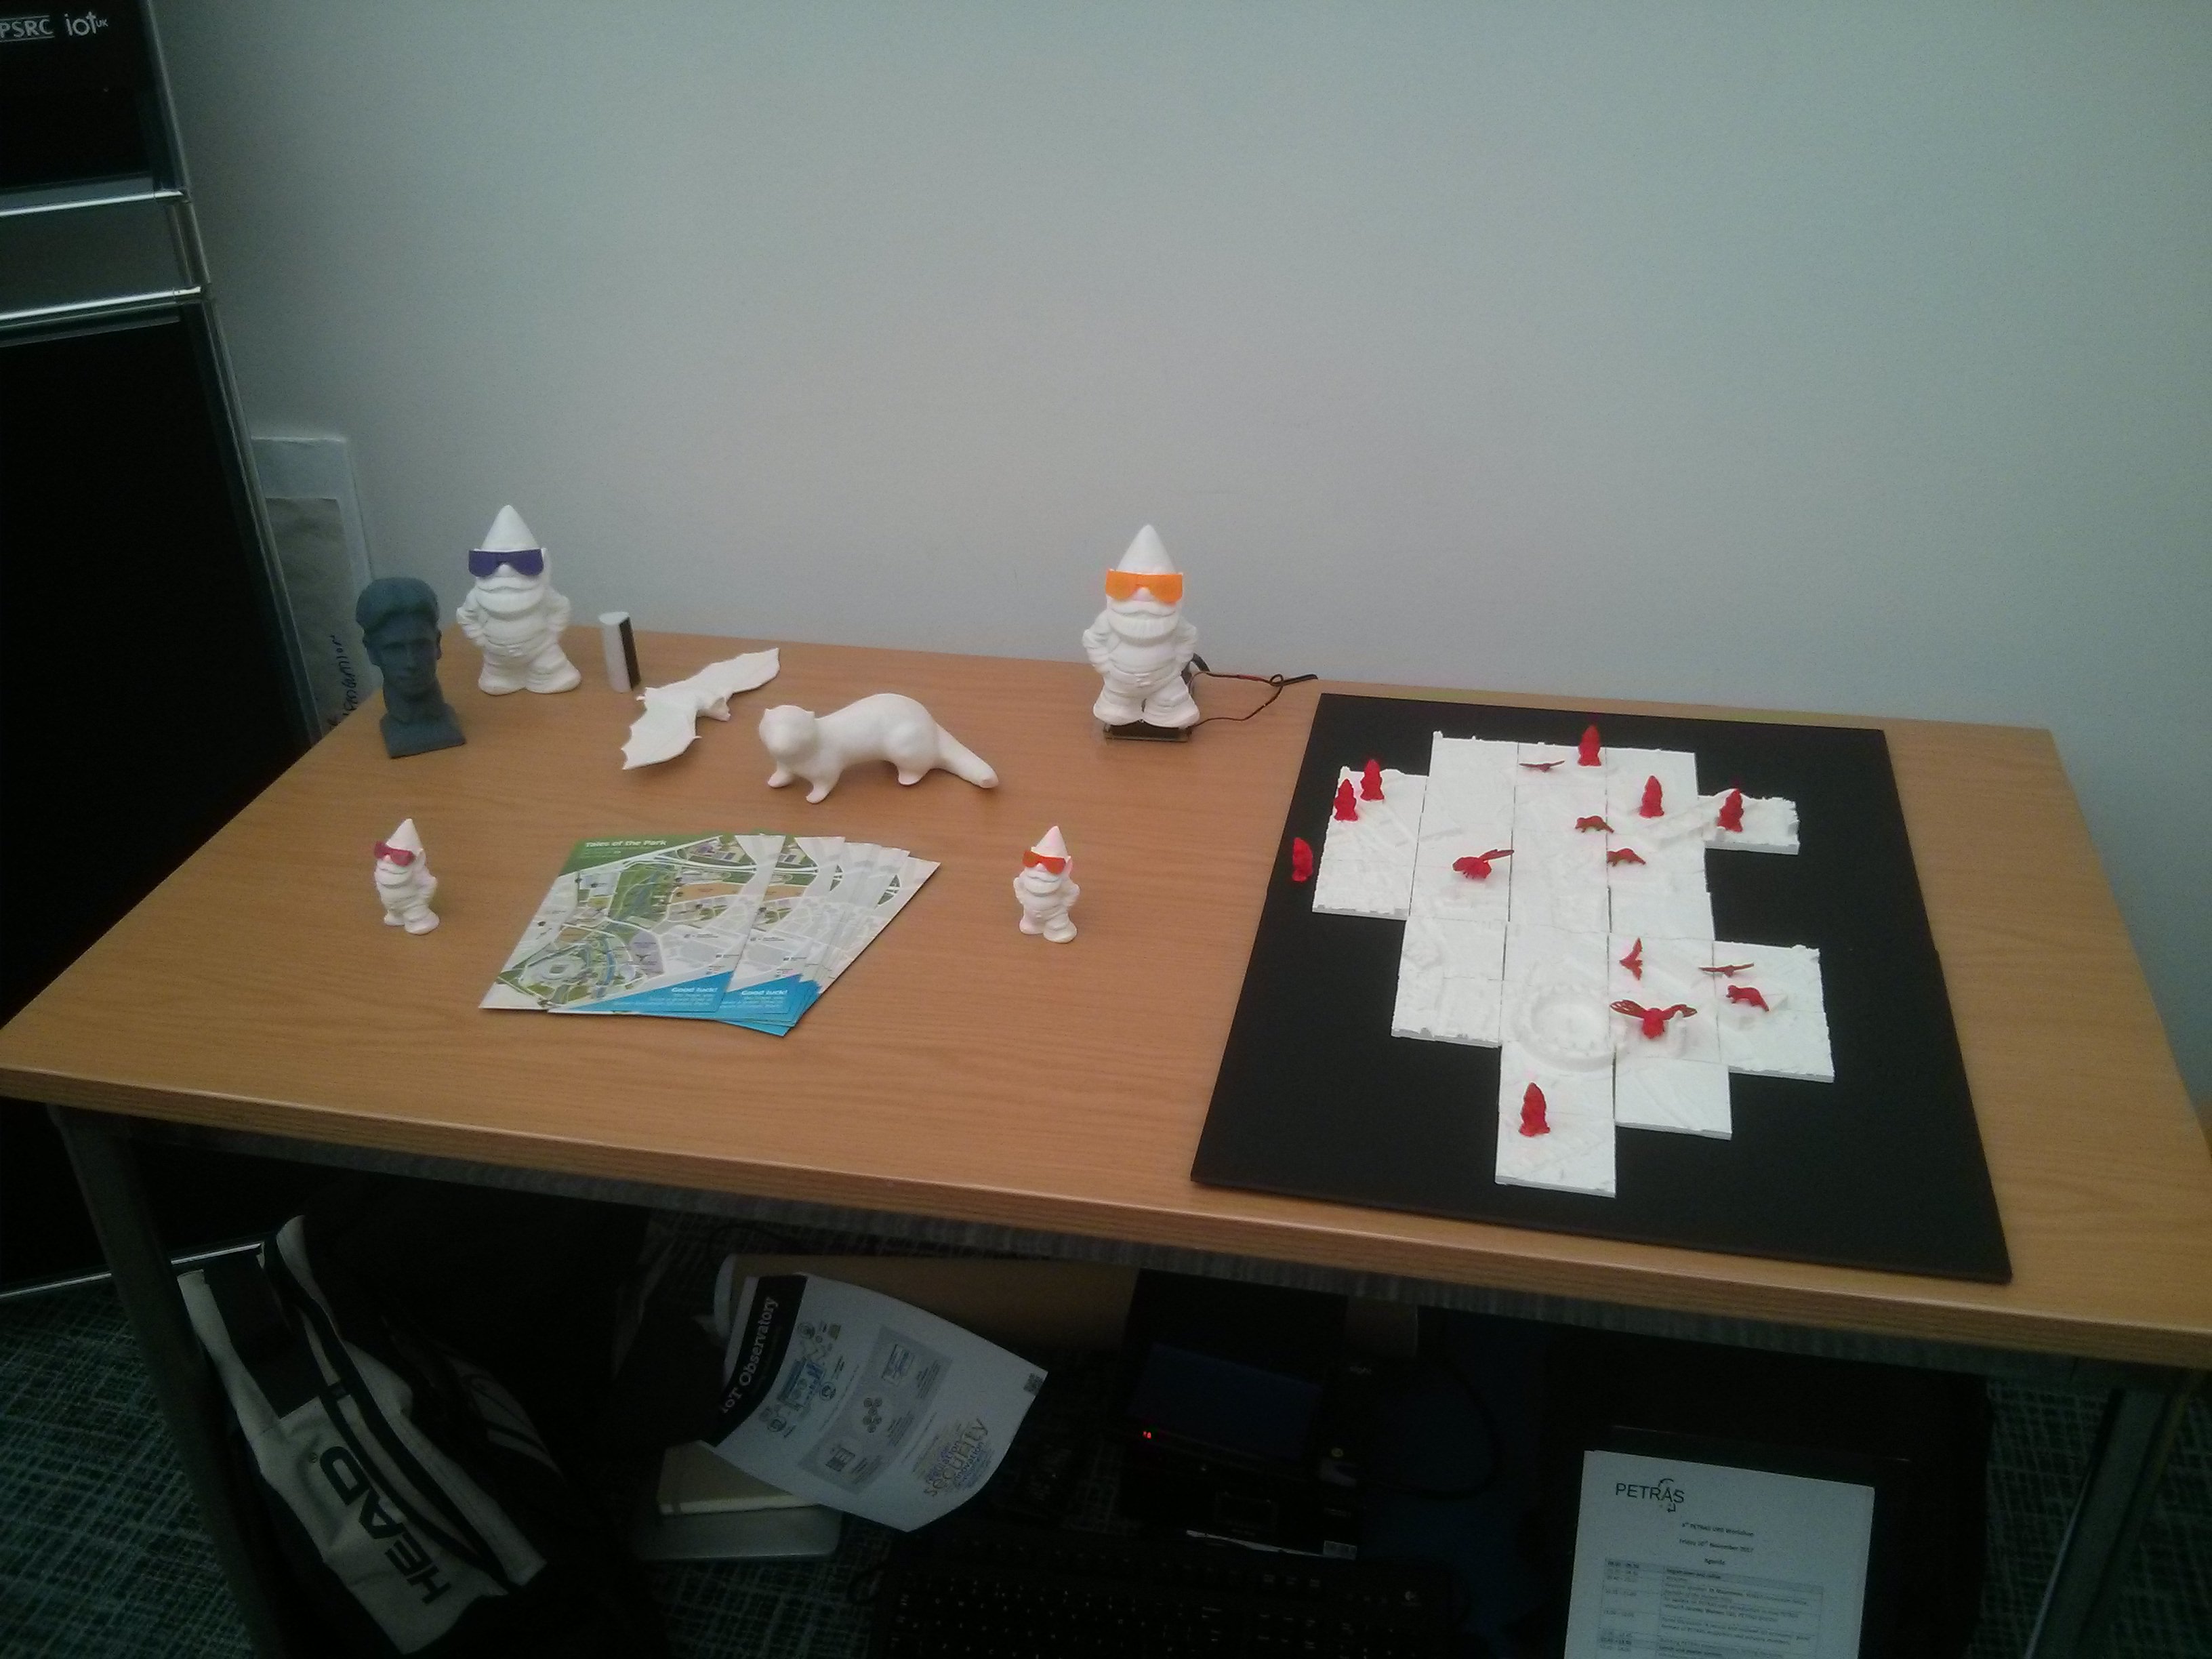
Now that all 15 gnomes, otters, bats and honeybees are deployed in the Olympic park [link], I wanted to create something that was portable enough to take to an exhibition and that showed the geographic extent of the deployment. The talesofthepark.com website has a map, but I wanted to create something physical.

Rosie the Bee, currently deployed at the ArcelorMittal Orbit and waiting for people to talk to her on their mobile phones.

My first thought was a Unity application with a 3D model of the park using the conversation data that we’ve collected so far. The idea was to zoom in on one of the creatures, show the conversation with the park visitor using speech bubbles, then zoom back out and repeat for the next conversation.

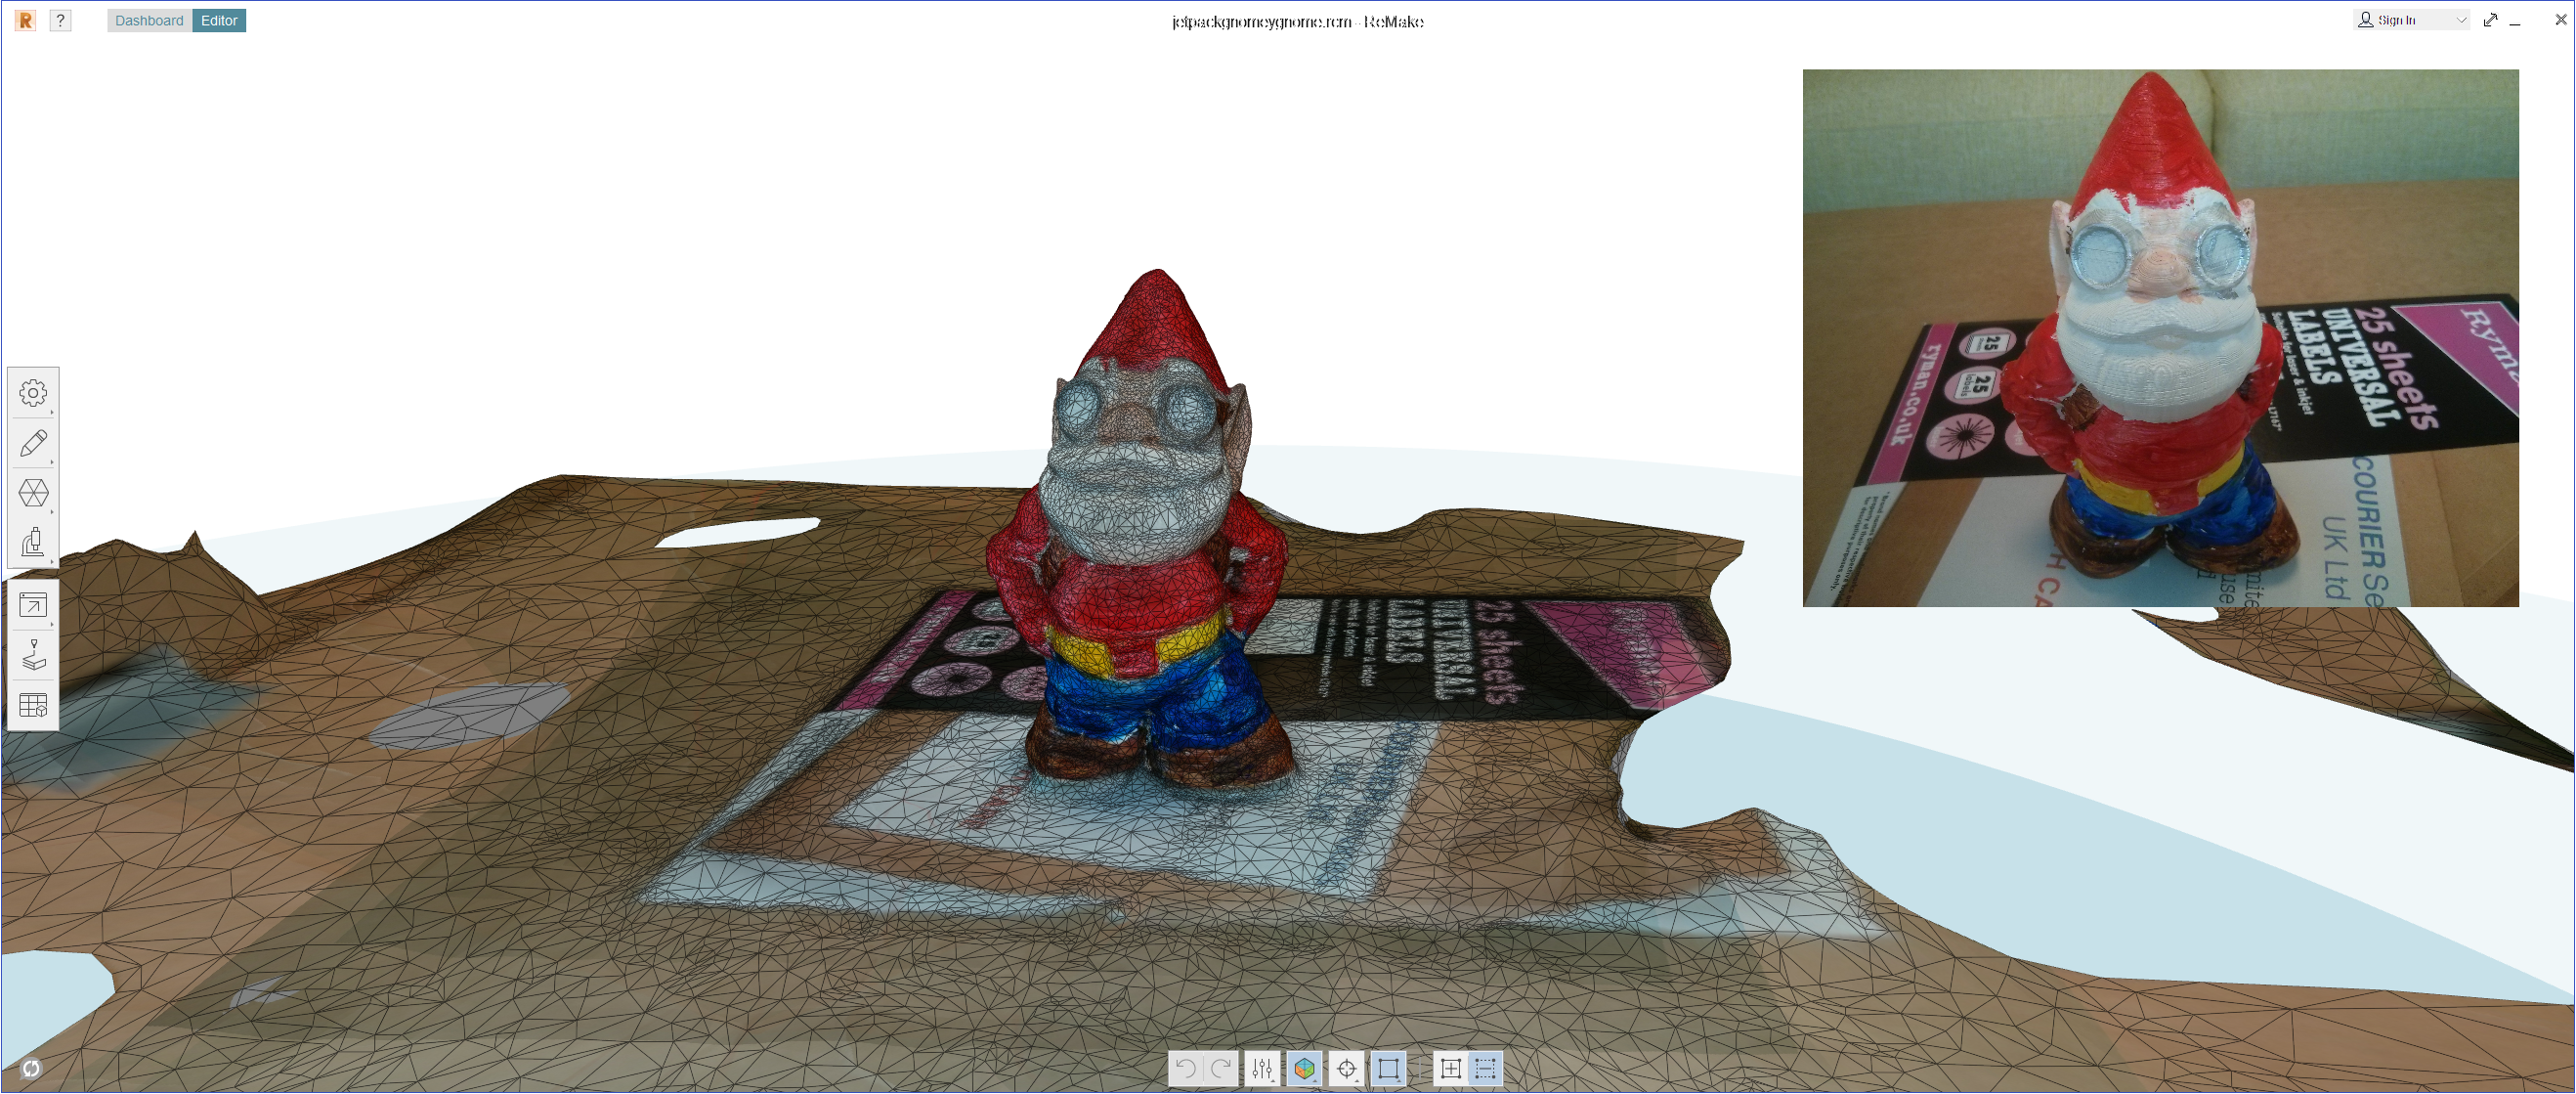
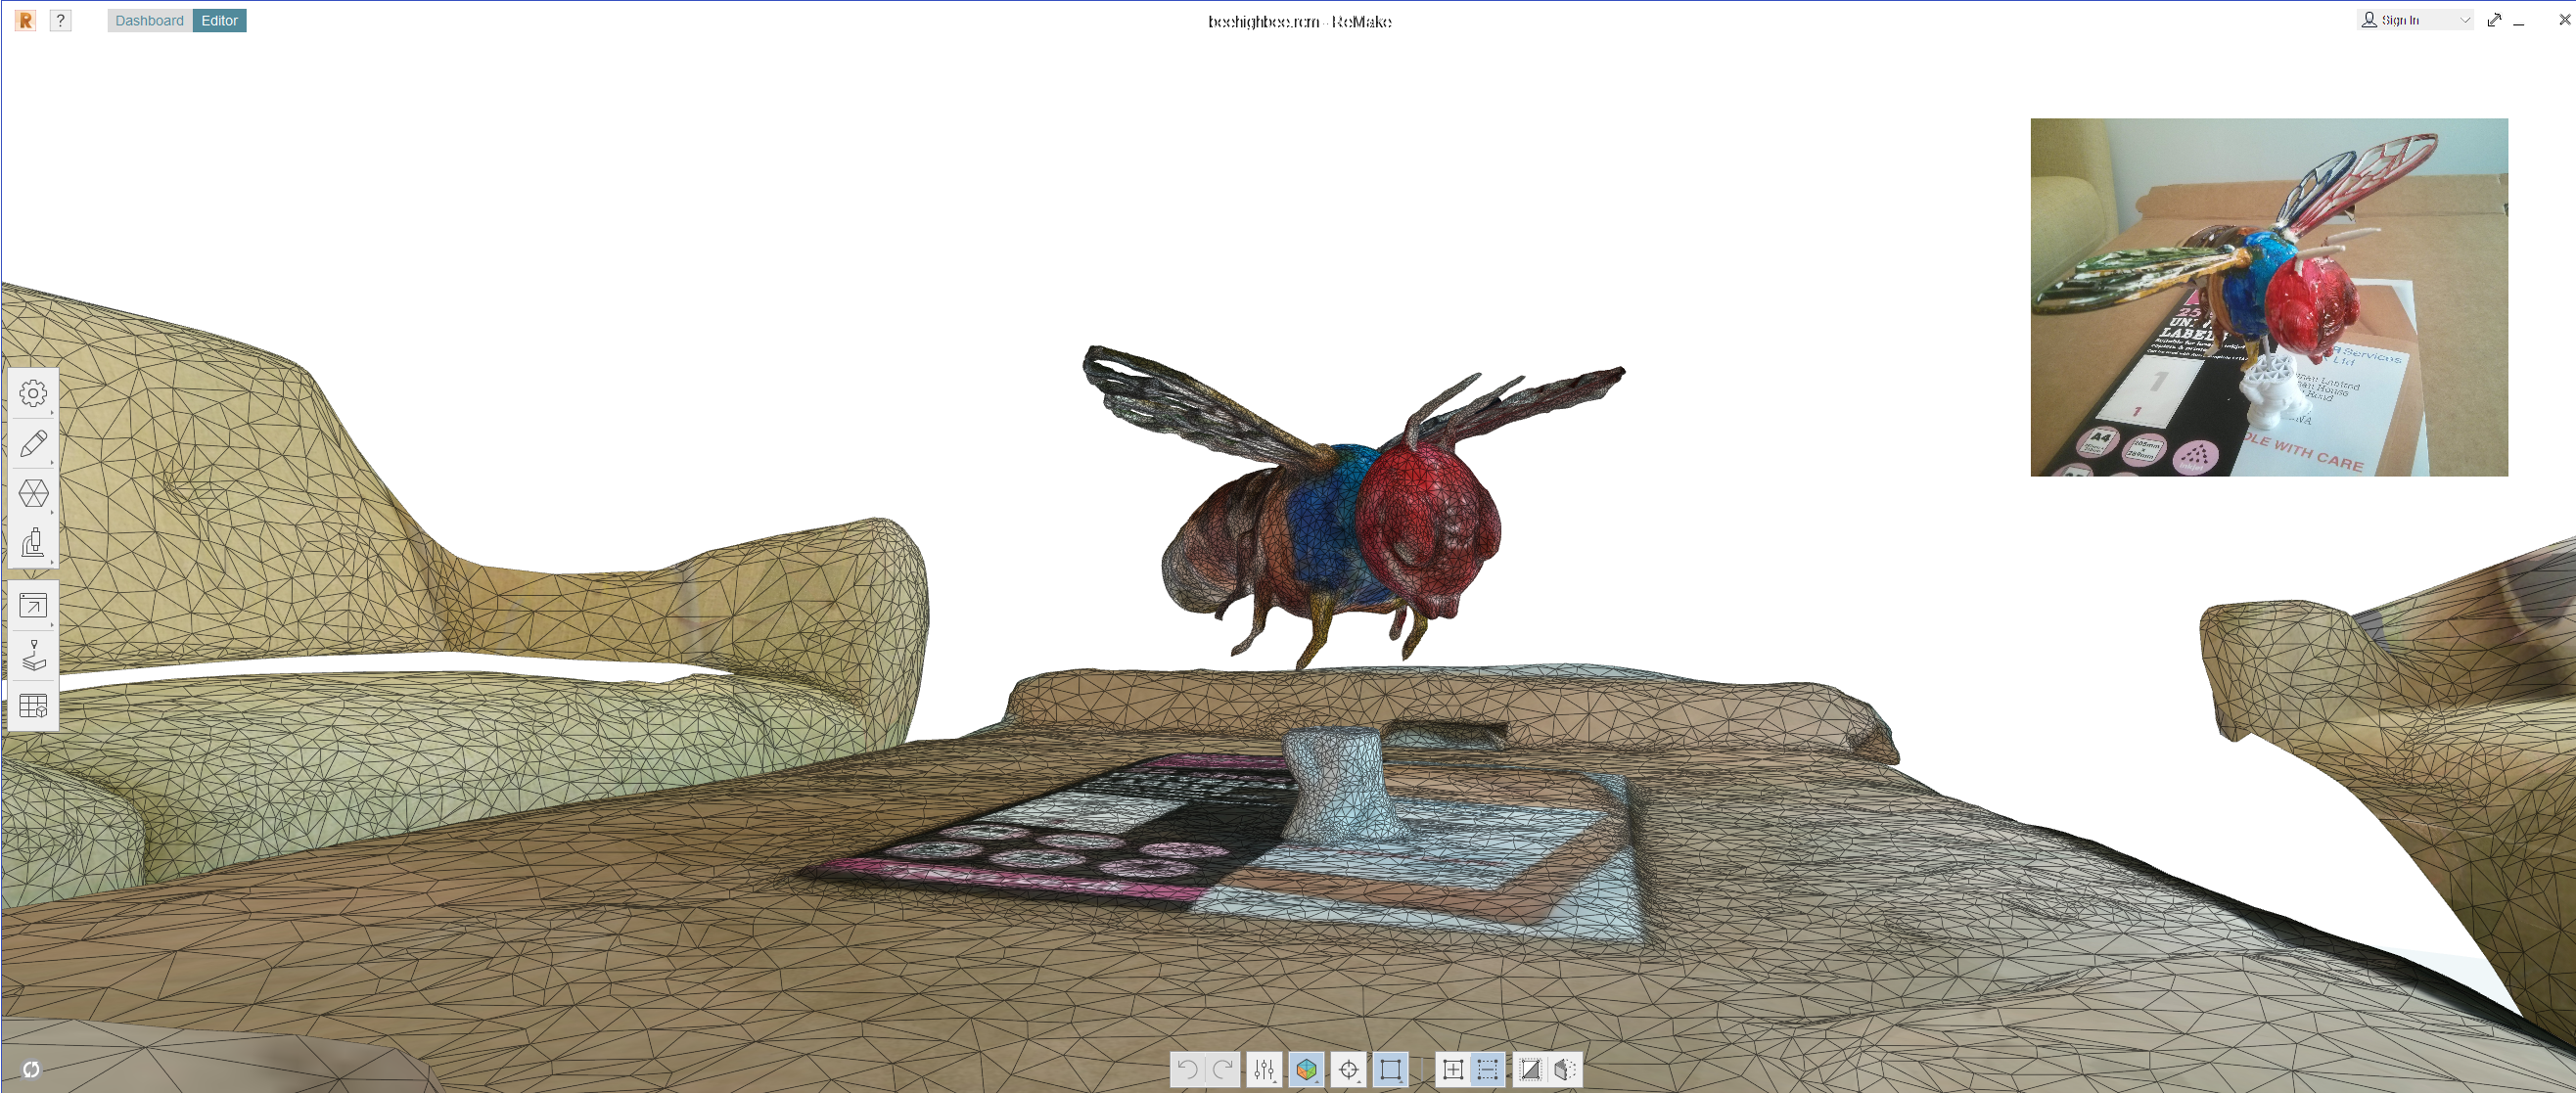
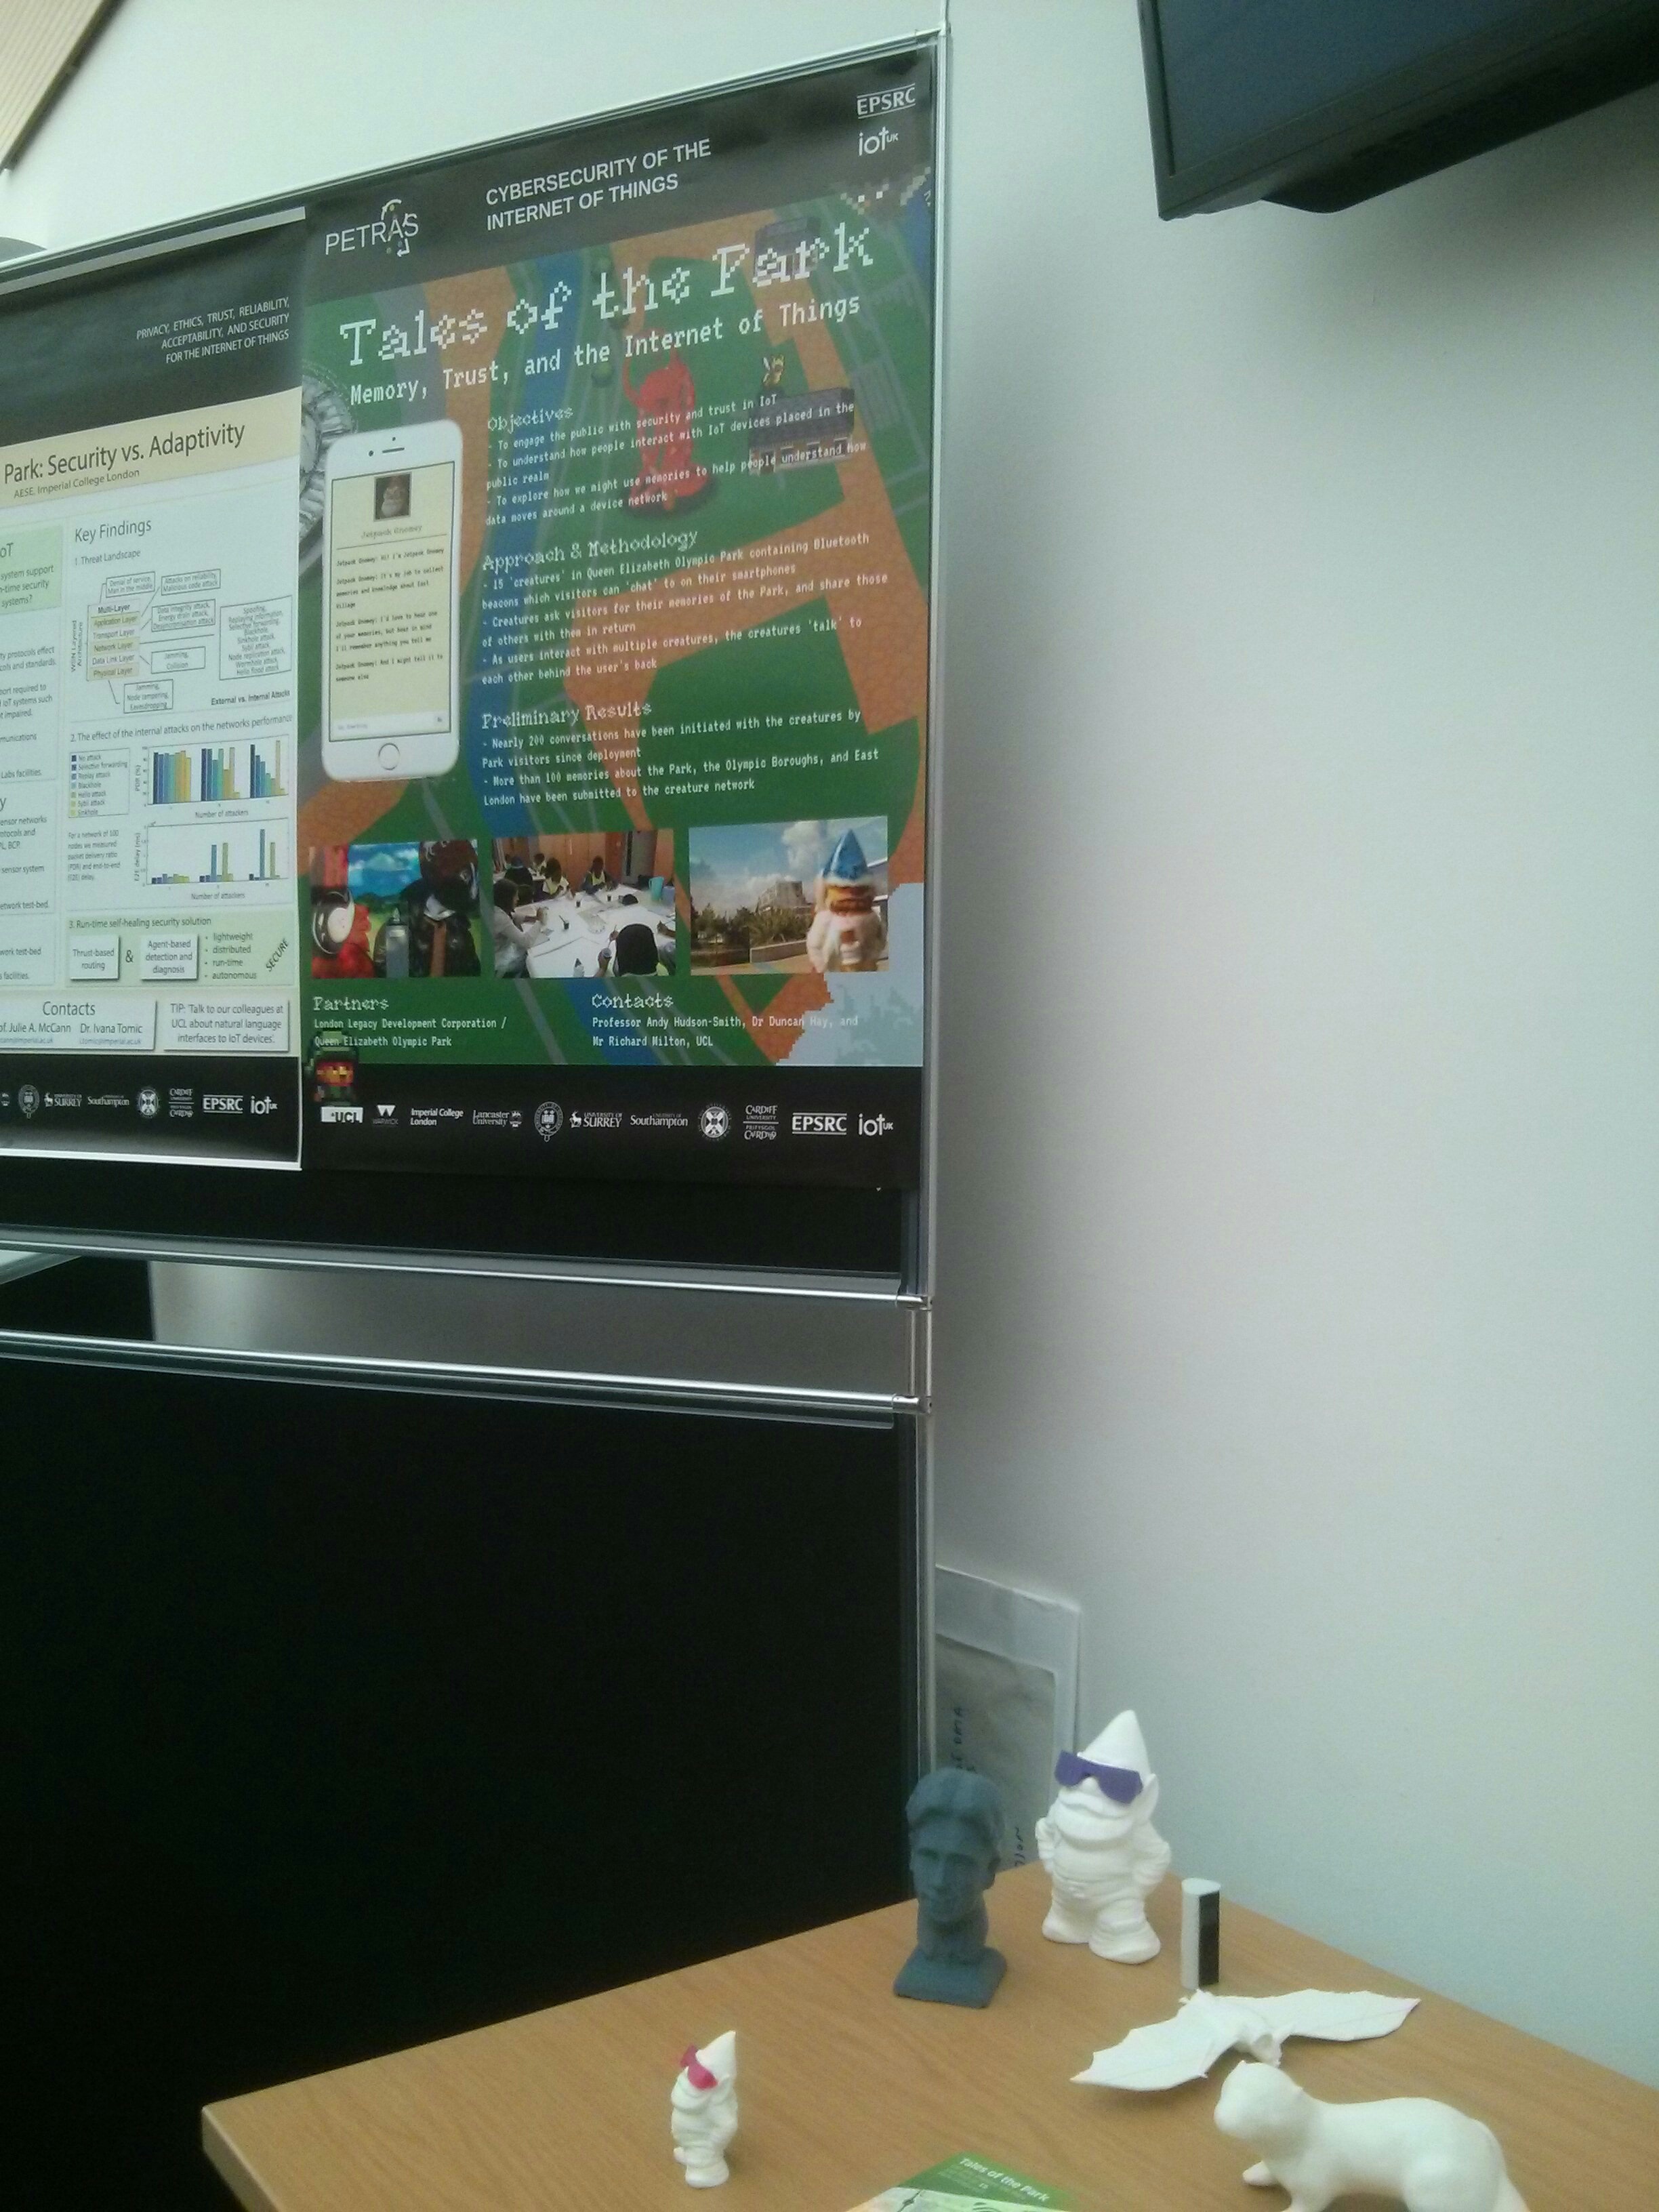
Luckily, we have 3D scans of all the printed and painted models which were reconstructed using Autodesk Remake.

“JetPack Gnomey” in his 3D reconstructed model form and (inset) as a photo of the physical object.
“BeeHigh” the honeybee.

The only problem was the park model to show where the creatures are located. This is where I hit on the idea of using the Environment Agency Lidar data which was flown for the park in 2012:

https://data.gov.uk/dataset/lidar-point-cloud

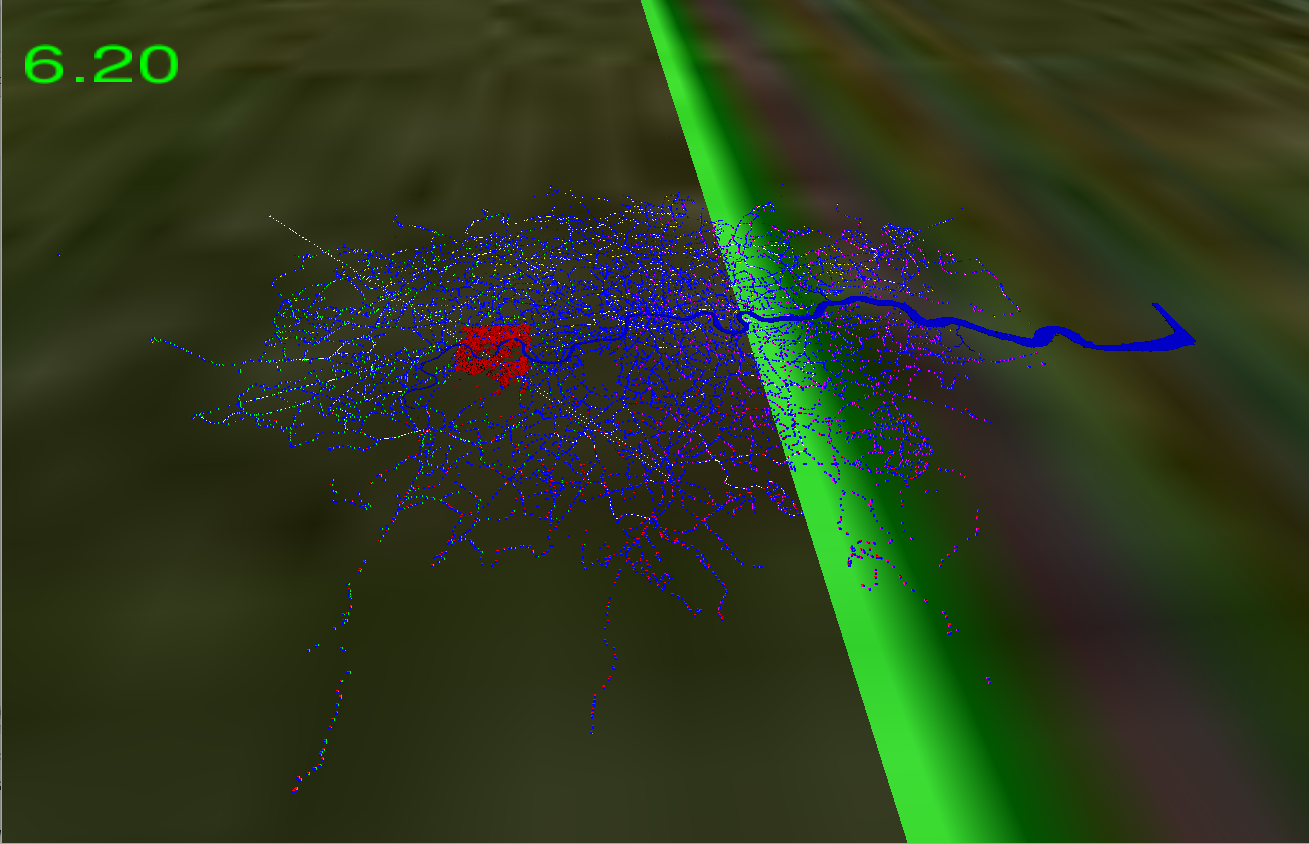
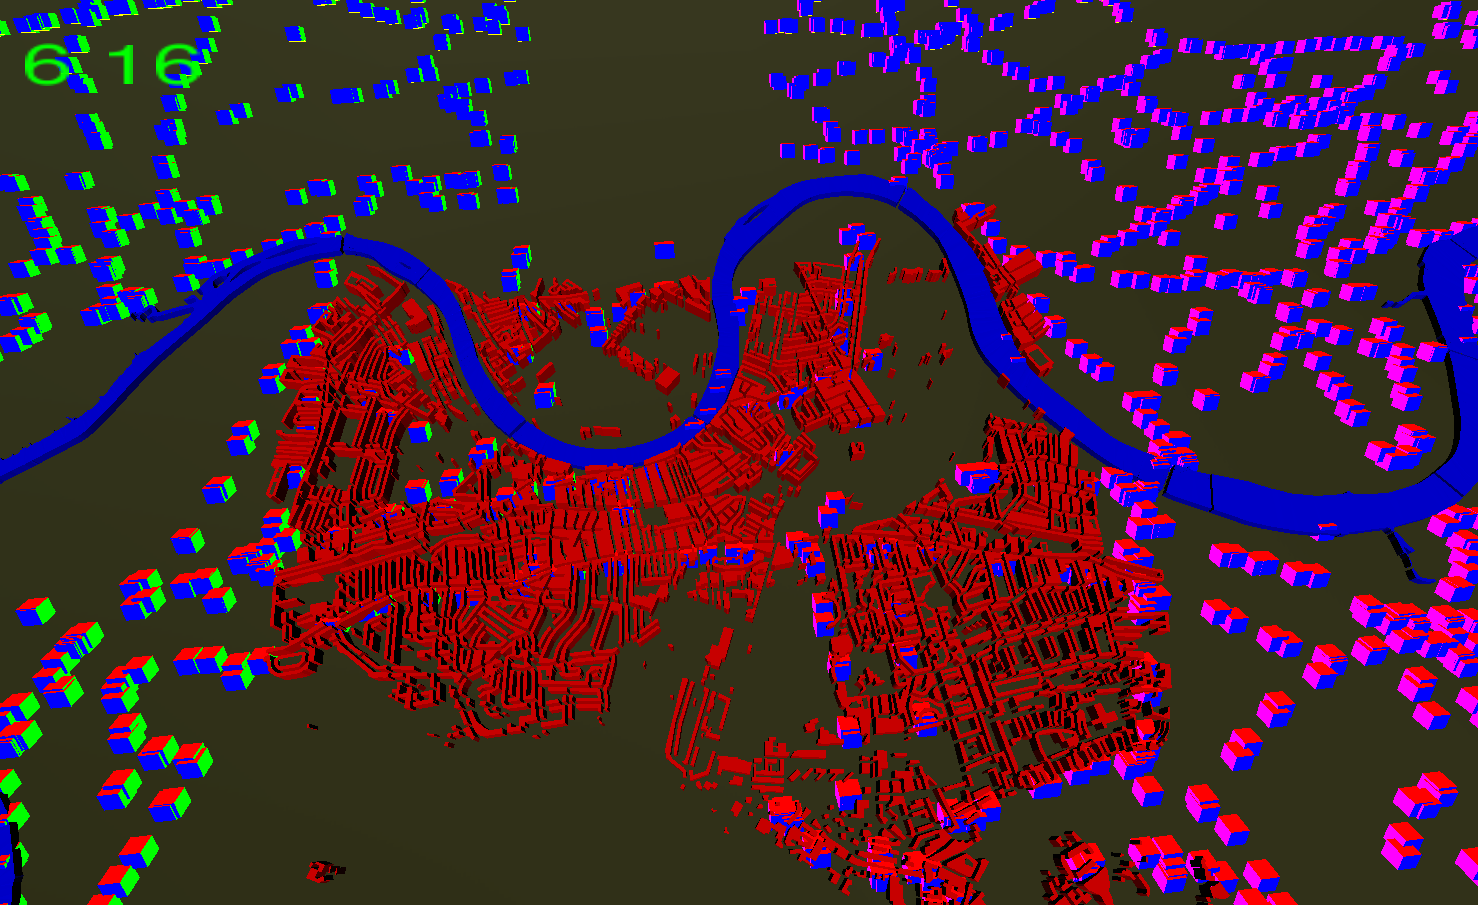
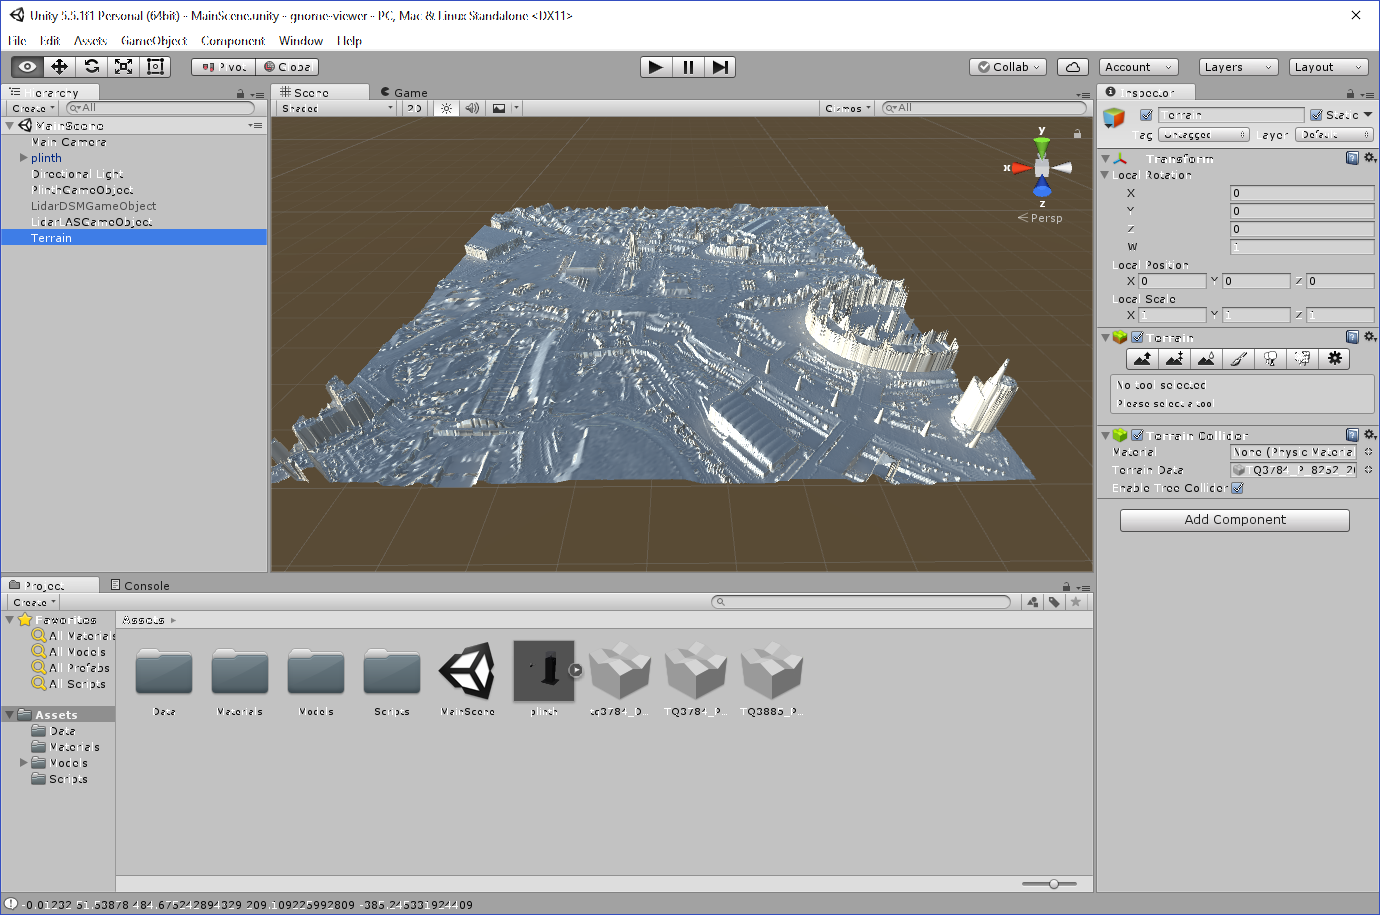
It’s relatively easy to load ASC format DEM and DTM files into Unity as it’s a text format, so I wrote some classes to load the data and generate a “Terrain” object which I could drag into my scene graph. Having done this, I then wanted to do the same with the point cloud data that they have released in LAZ format. This was a bit more involved and took a couple of days work. I used the “LASTools” utility to convert the compressed LAZ file into an uncompressed LAS one and ran it through my Unity Lidar reader.

Unity viewer with a terrain object showing part of the Olympic Stadium (right edge), generated from the point cloud Lidar data contained in the Environment Agency’s LAZ files.

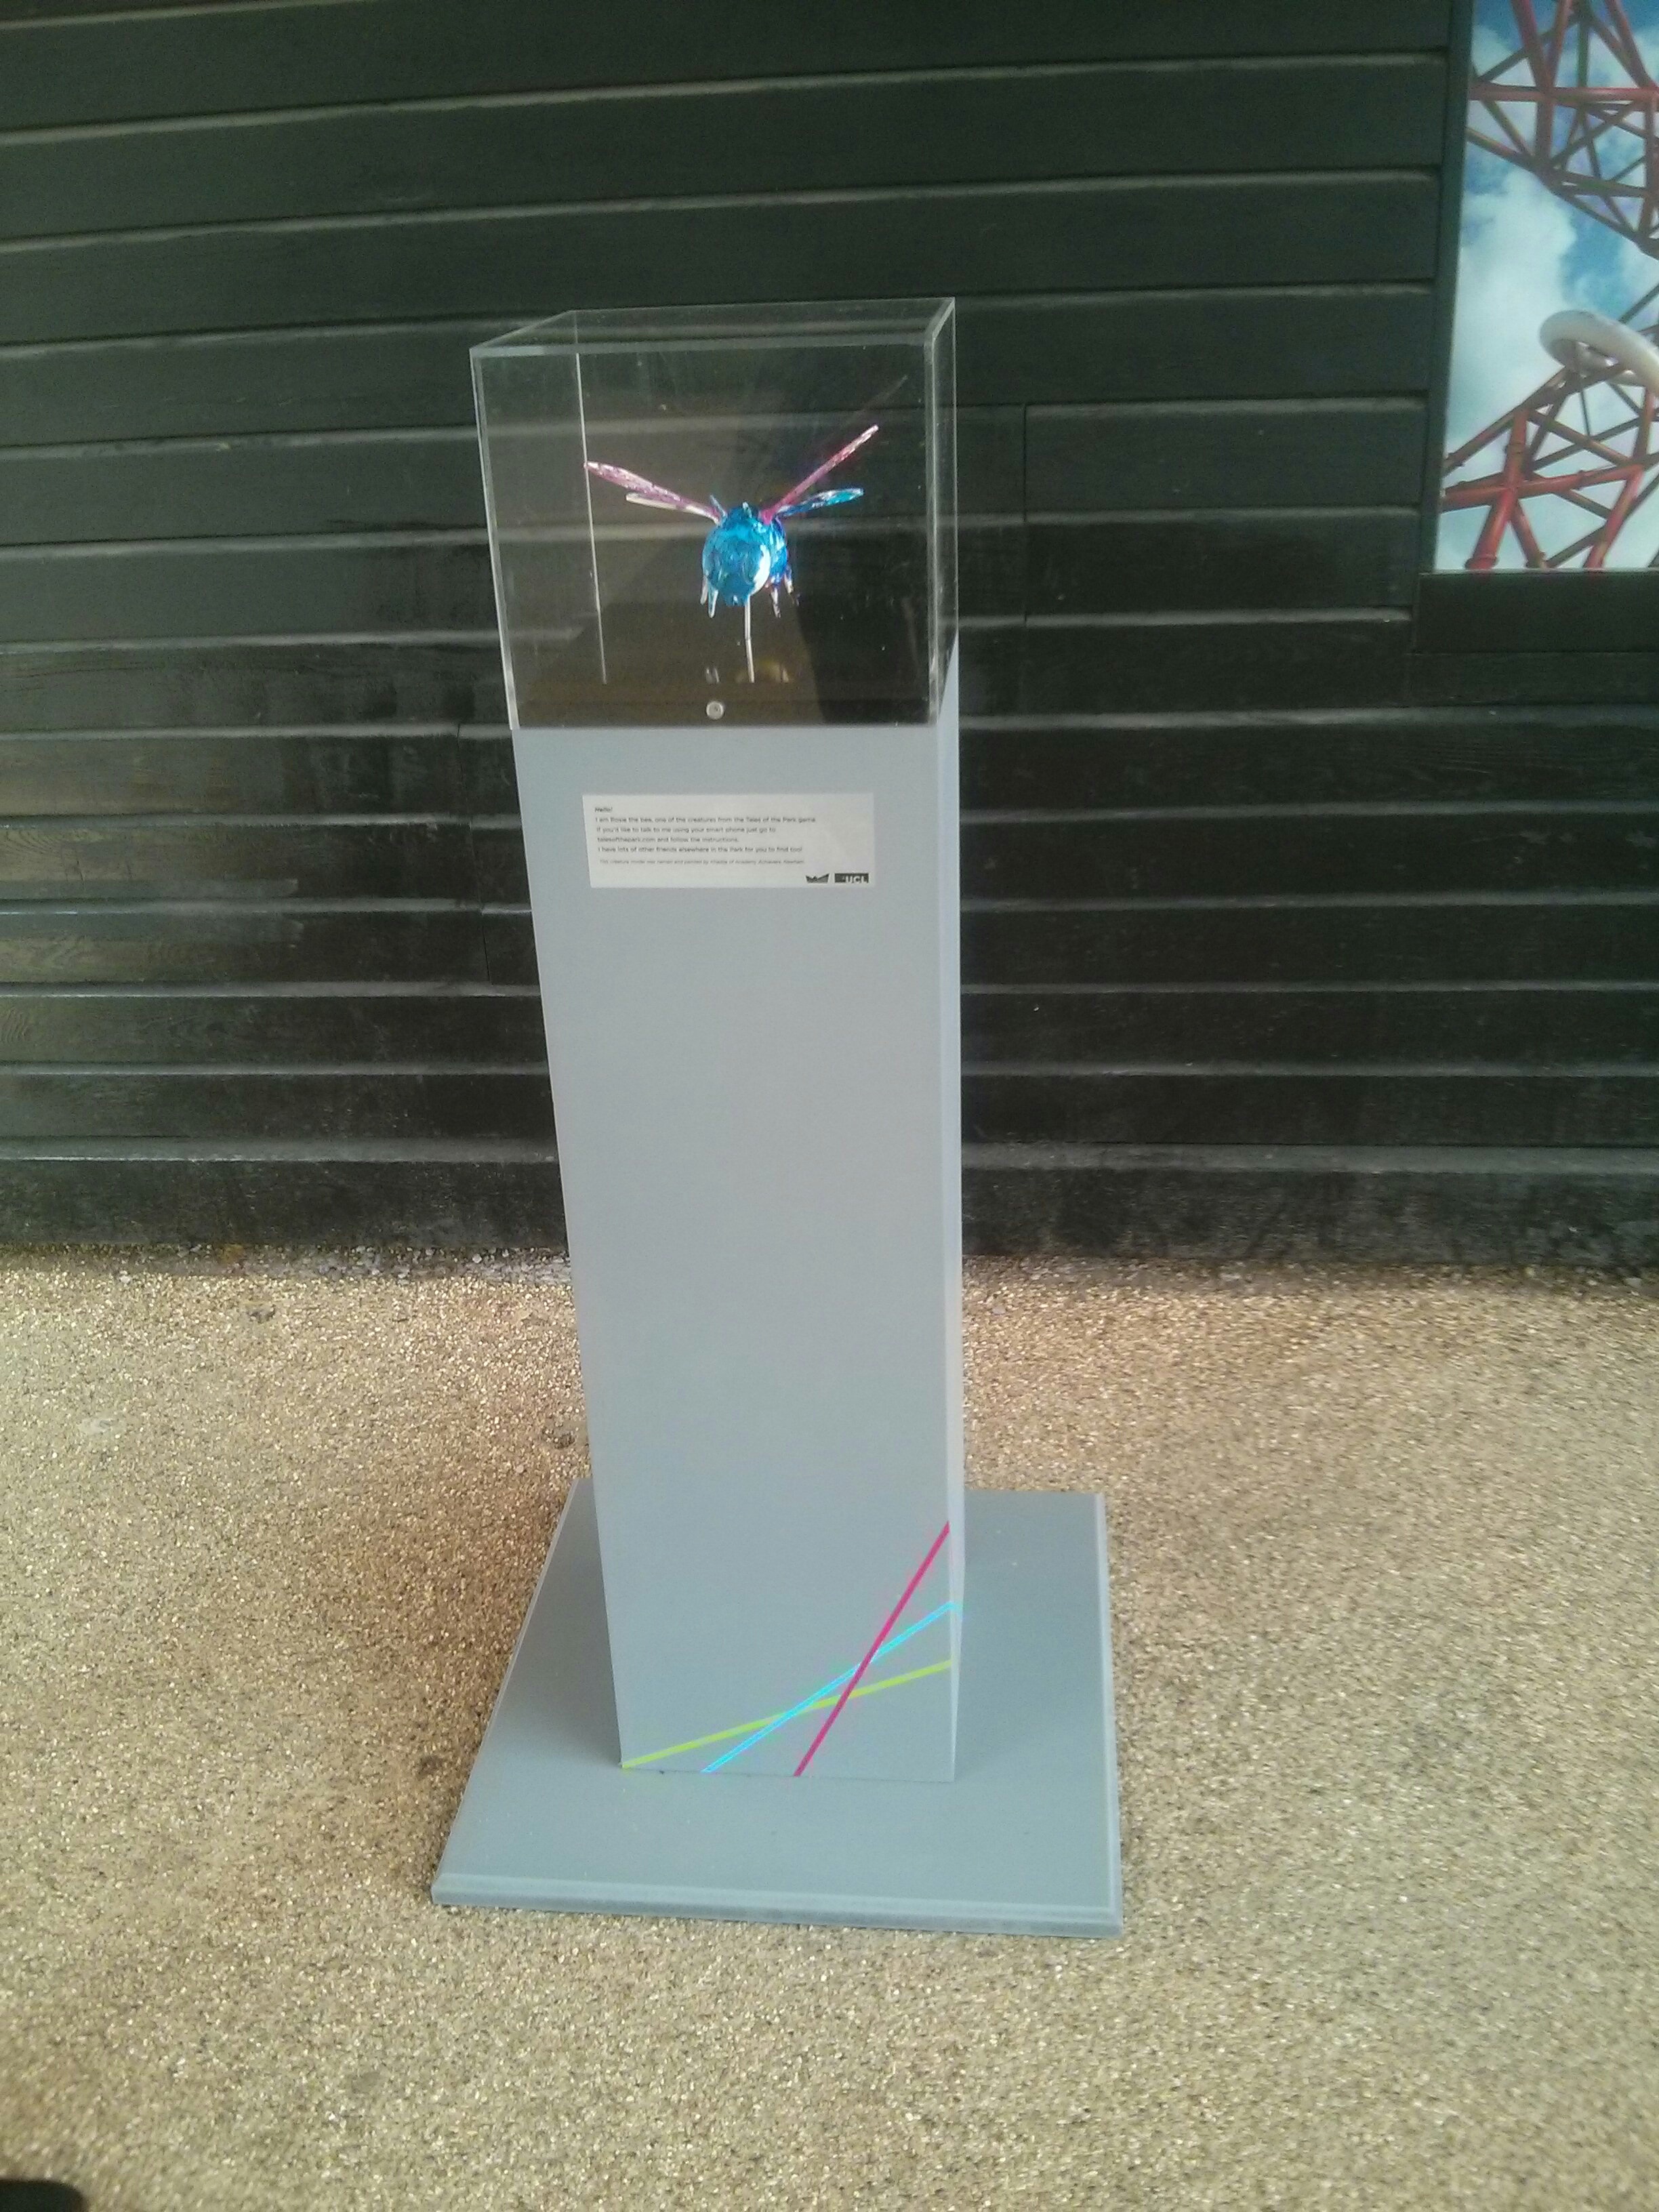
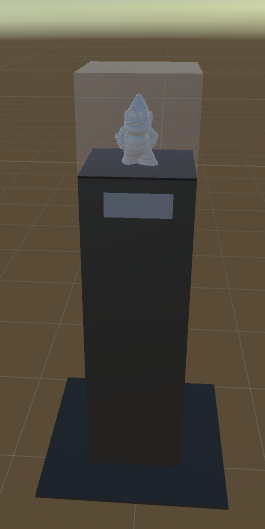
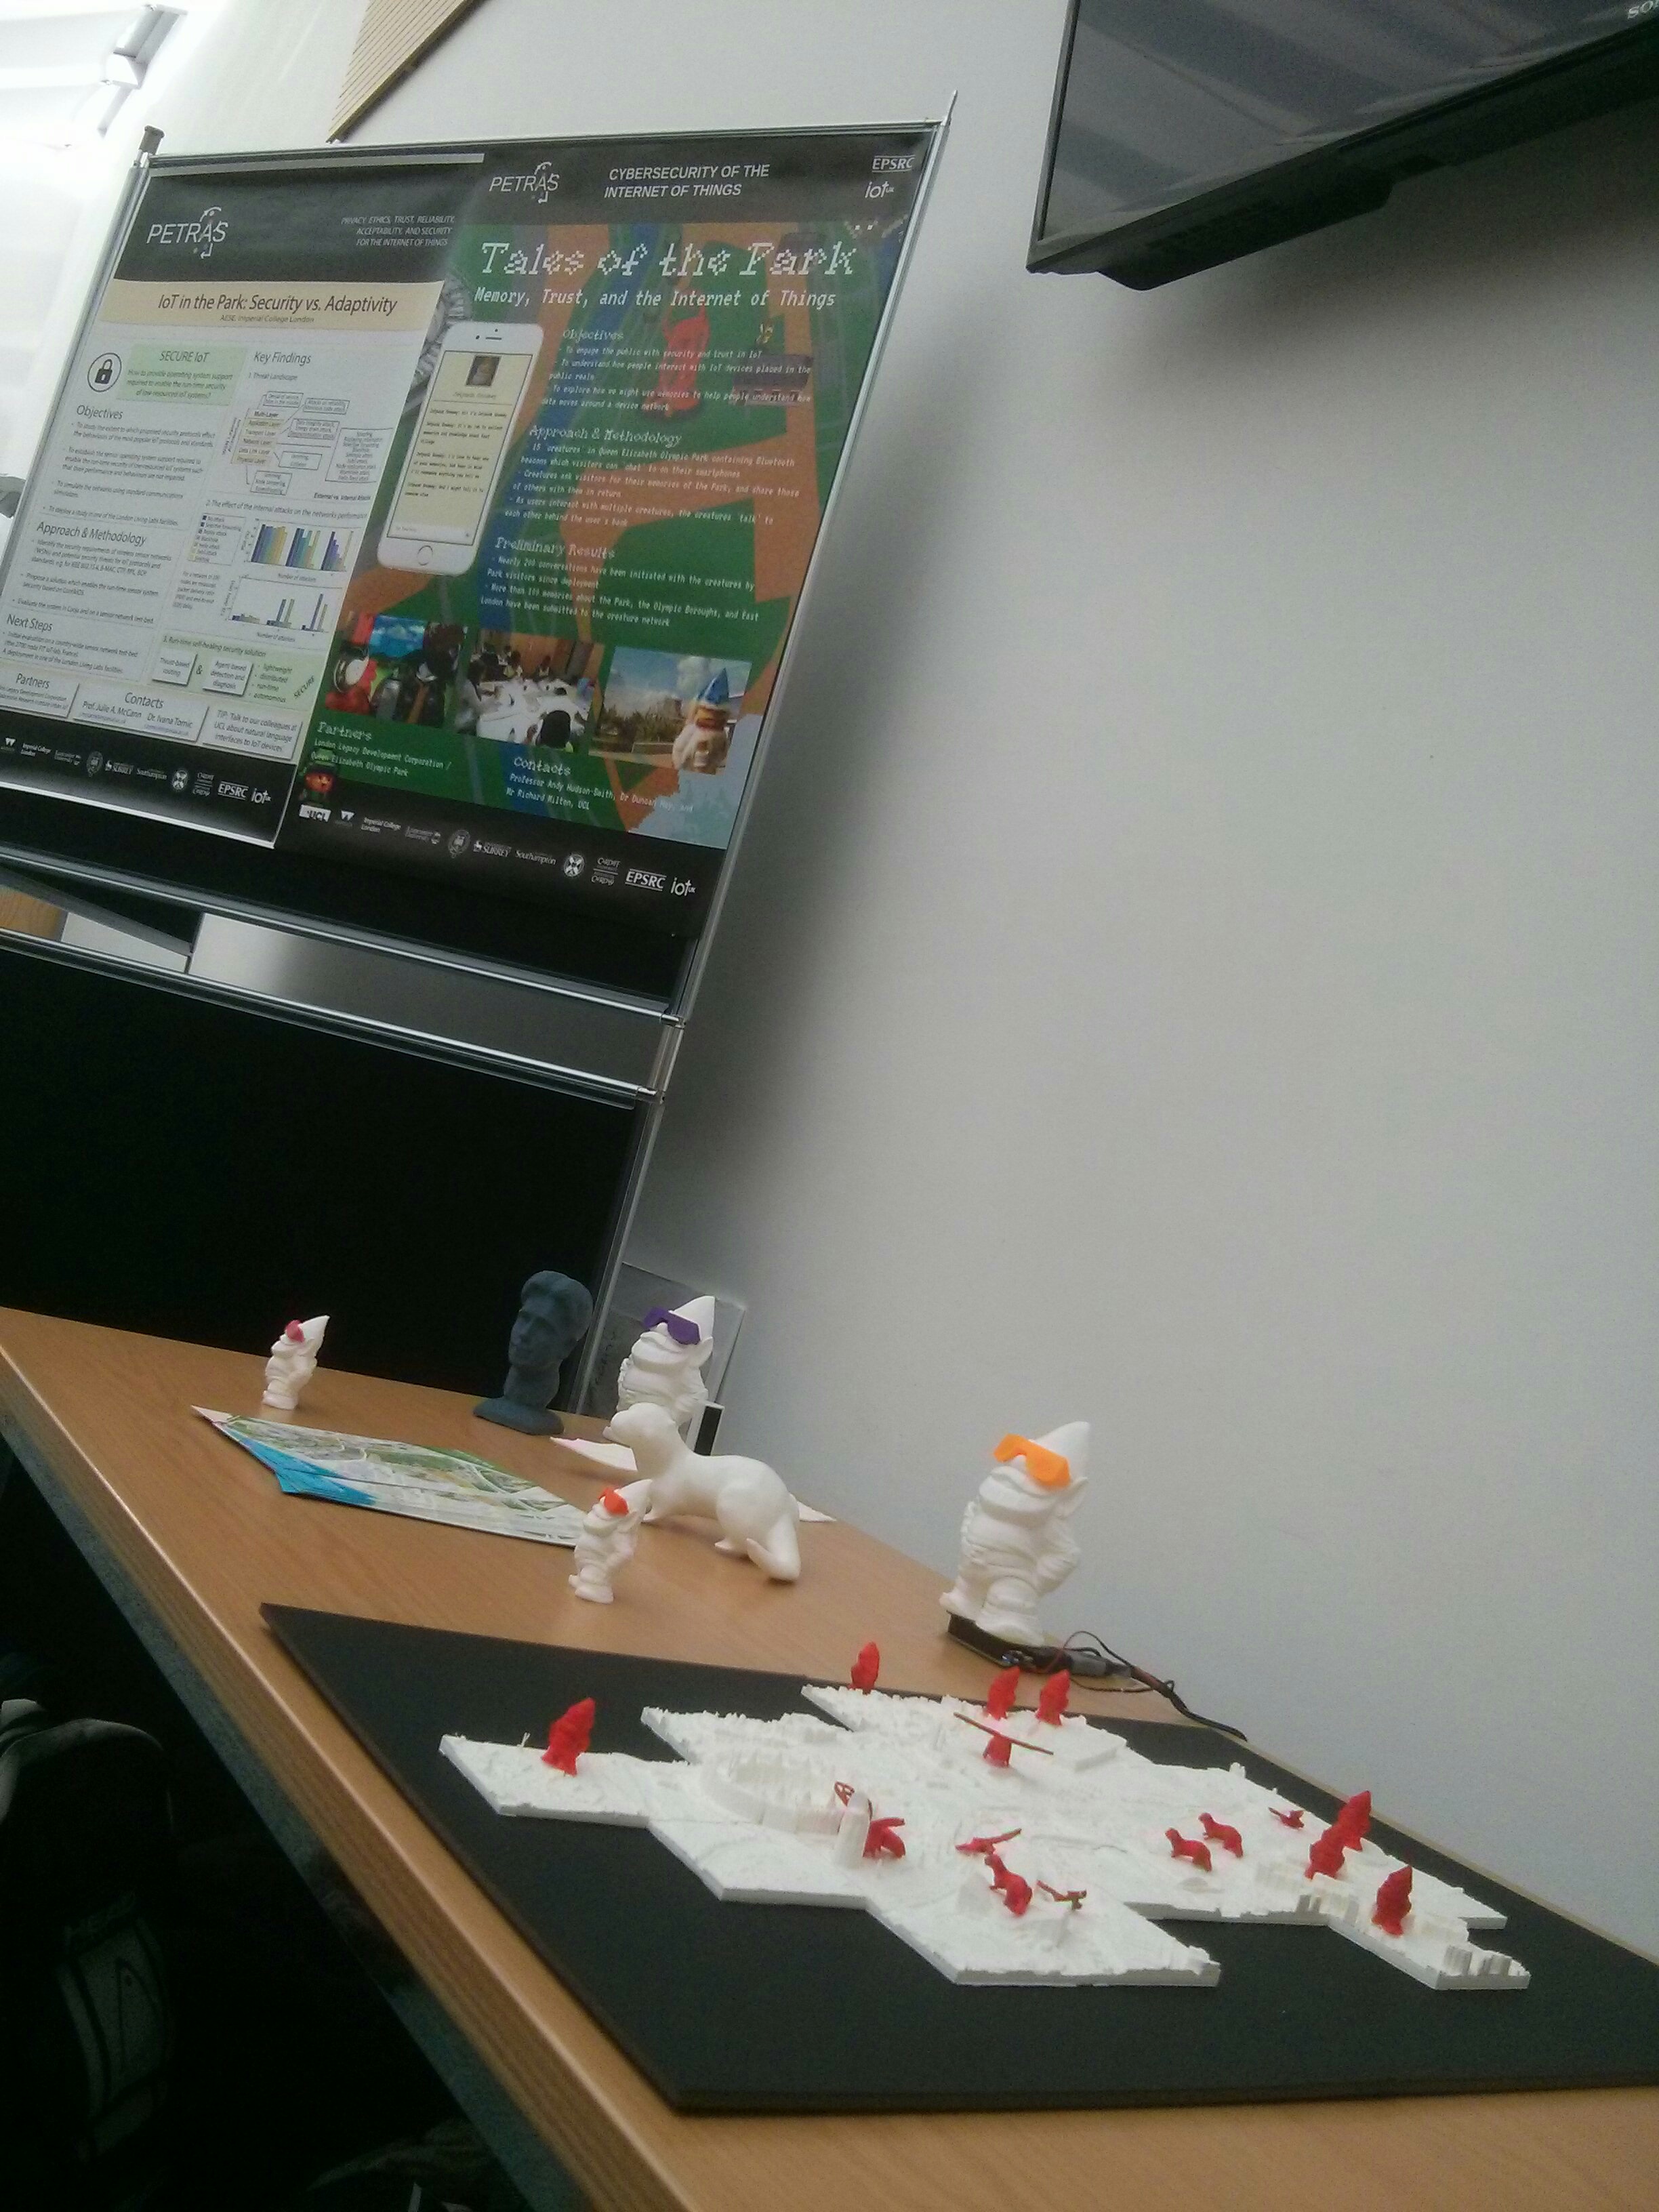
Although I had a 3D model of the gnome on the plinth and could now have built my “gnome viewer” application, I was really interested in whether I could build a physical exhibit for the upcoming PETRAS conference.

The virtual gnome model in Unity.

The only missing element was that Unity doesn’t provide any functions to export terrain meshes, so I had to spend a couple of hours writing an OBJ file exporter. At this point, I now had all the pieces in place to generate Lidar tiles, export them as OBJ meshes and prepare them for 3D printing using CURA.

This is my first attempt:

My first Lidar file 3D print using an Ultimaker 3 printer. The tile is 10cm x 10cm. NOTE: if you compare this to the terrain map in Unity, the virtual one is reflected due to my getting the Z axis wrong. The 3D print is correct and I’ll go back and correct the Unity terrain import later.

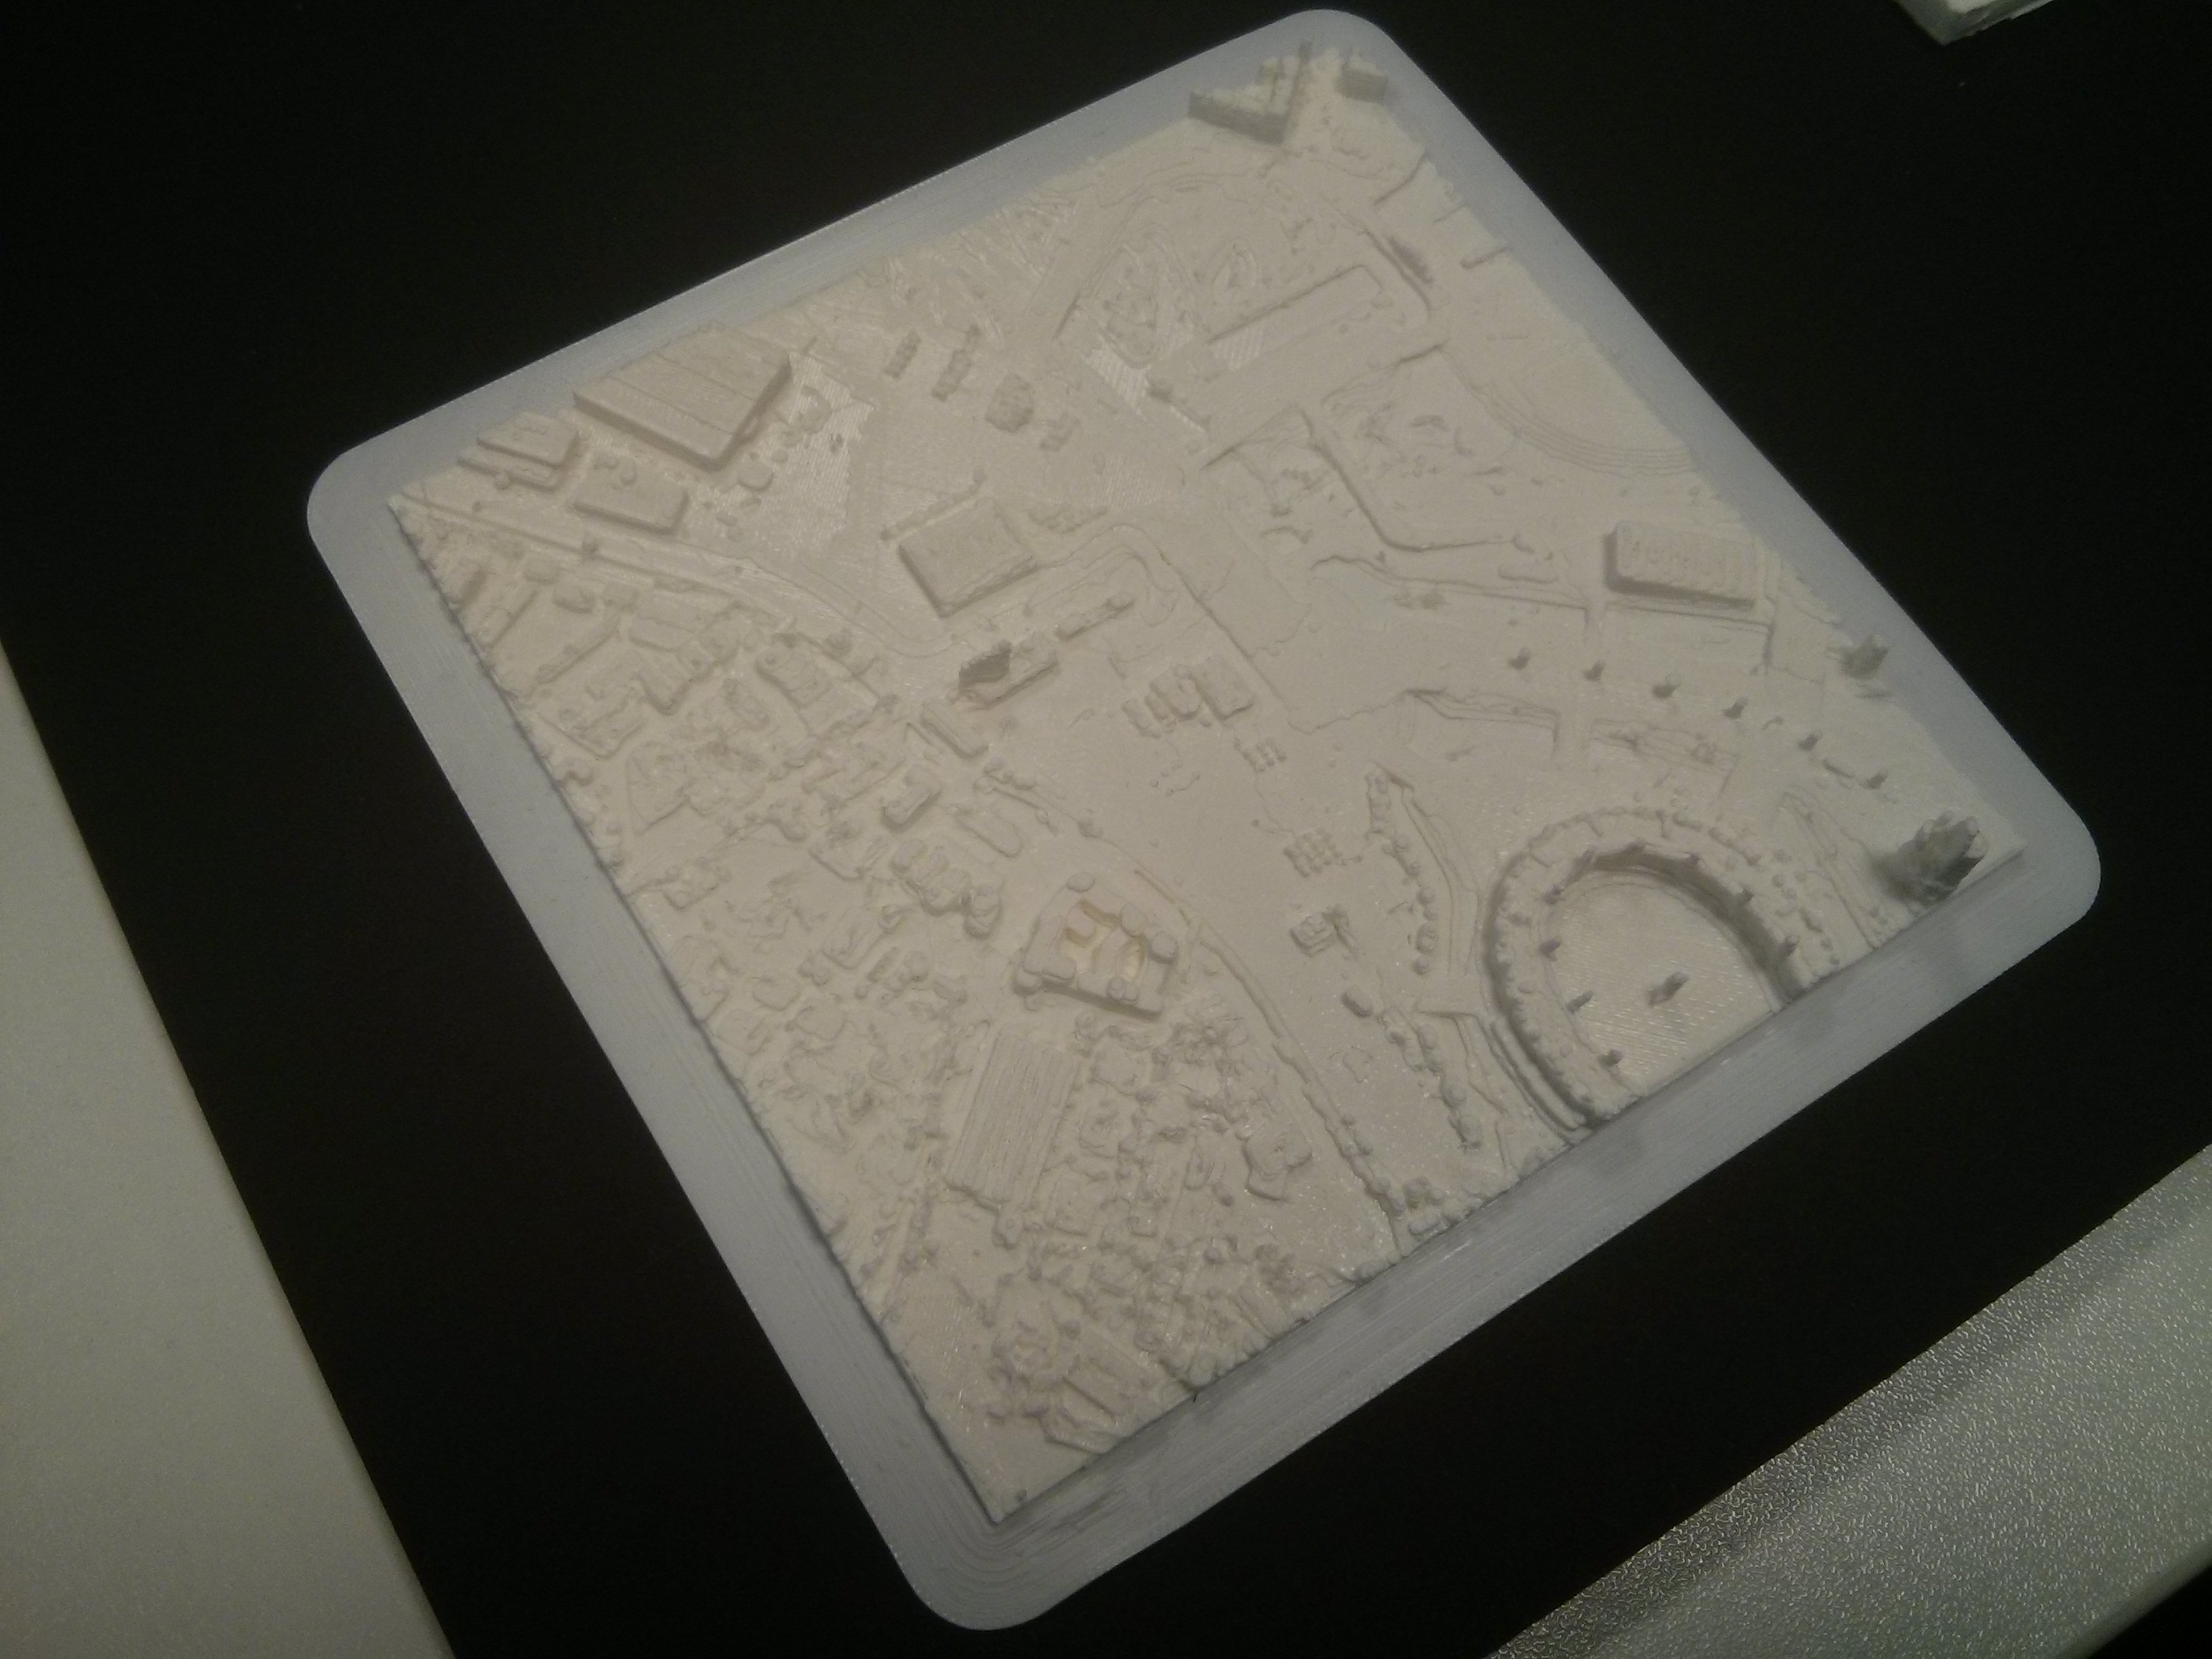
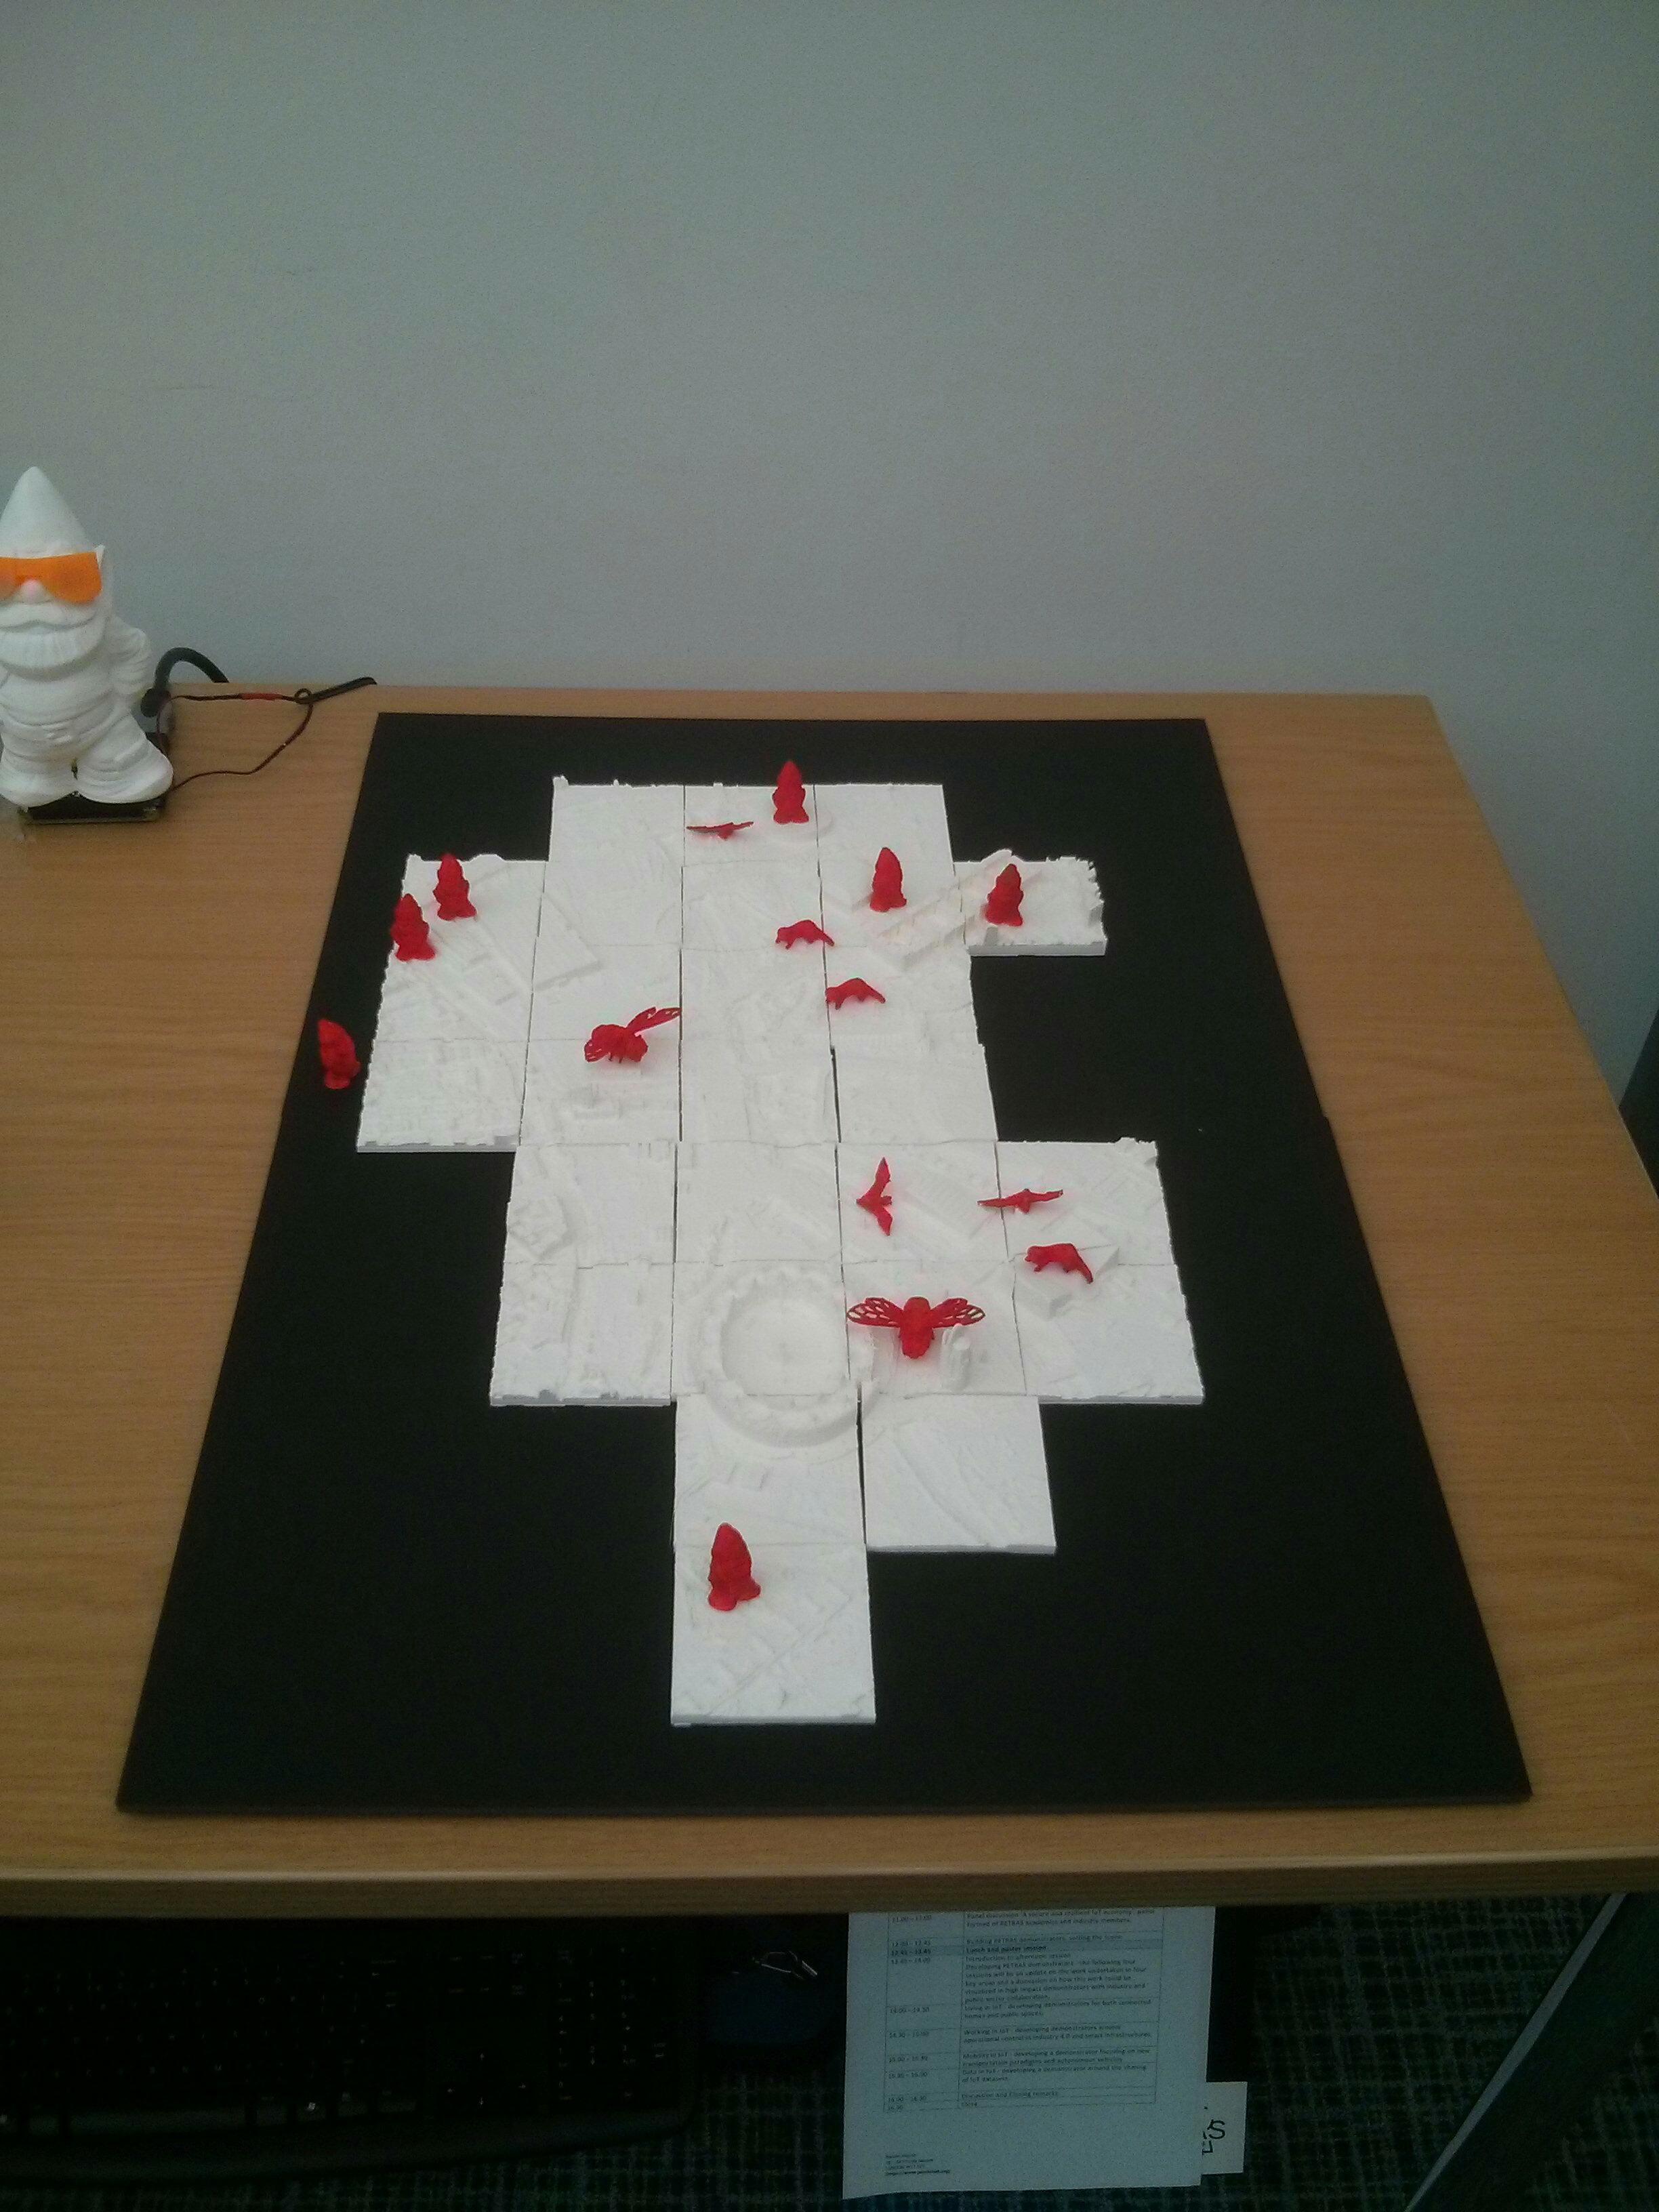
While this isn’t bad for a first attempt, I needed it bigger as I wanted to see more resolution on the buildings. In order to do this I needed to split the tile above into 16 (4×4), scale the 1/16th tile up and print them individually. These 1/16th tiles were printed at a scale of 6.2cm x 6.2cm, which came from loading them into CURA, whereby the size was too big to fit the print bed. Rescaling by 25% of the original size gave me a tile that fitted the printer and took around 2 hours to print. The small tiles are about 2.5 times the size of the original 10cm one, allowing me to print the whole park map in about 10 days. More importantly, it’s a portable, so I can take it on a train to exhibitions.

The 3D printed Queen Elizabeth Park map at the PETRAS Conference held at the Rothamsted Centre in Harpenden on 10th November 2017. The red creatures show where they are deployed in the real park. To give a sense of scale, it’s 2 kilometres from the top to bottom of the map.
The large gnomes are the size deployed in the park, with the orange one “talking” using a text to speech system so it can speak all the conversations collected from visitors so far. The purple gnome talks about bats. The otter and bat models are also visible, along with some smaller gnomes and a grey George Orwell head.


And we had a poster too.

OK, the map needs to be a little bit bigger, but I ran out of time.

Now that I have the methodology to do this for anywhere in the UK using the EA Lidar data, I’m thinking about tidying up the code and publishing it on the Unity App Store. It’s quite a useful thing to have and I’m sure other people would be interested in using it.


The Piccadilly line is currently experiencing severe delays due to the non-availability of trains

piccadillyline_wheelflatproblems2
Number of tube trains running on the Piccadilly Line between 21 November and 20 December 2016. Unfortunately, some data was lost between the 8th and 9th of December. The numbers on the x-axis are the day of the month and the hour.

It seems that the Piccadilly line is only just getting back to normal after a problem with flat spots on the wheels of 50% of the trains: [TfL Link].

Looking at the data for the number of trains running, this seems to stem from around the 24th November (Thursday) when the numbers started to drop off. Analysing this data is problematic because of the noise inherent in the data collection process and the need to take weekends into account. There is also the launch of the Night Tube on the Piccadilly line which happened on Friday 16th December.

Plotting the total number of tubes running over a 24 hour period as a moving average makes things a bit simpler:

piccadillyline_wheelflatproblems_24hourmovingaverage

The data break is immediately evident on the 8th and 9th December, but the numbers can be seen to be dropping from the 23rd to the 28th. Then the 5th, 6th and 7th of December (Mon to Wed) just before the data break is particularly bad. It’s interesting to note that there were more tubes running on the 10th and 11th of December (Sat/Sun) than there were running on the 5th and 6th (Mon/Tue), which seems to be the worst period for the Piccadilly Line.

While this is quite an interesting exercise, the real value of this type of analysis is in the effect it has on the commuter. Spacing between tubes of 15 minutes were reported and sections of the line had no service at all. What I need to develop now is a way of generating these spatial analytics automatically from the data as we collect it.

MapTube is Back

Somebody managed to do a SQL injection attack on MapTube recently, so it hasn’t been working properly for a while. Now that the vulnerability has been identified and fixed though, it’s back to normal again.

Looking through the logs, they’ve spent the best part of a month trying to do this, so I wish I had seen it earlier. It’s also been flagged by the main firewall as malicious.

I’ve had this idea for a while, but it occurred to me that we should be doing some spatial analysis on where all these attacks are coming from. They use groups of IP addresses which they change every day, but we have years worth of data now for a number of different web servers which could be analysed. The same applies to all the spam email that we’re filtering out. Just looking at the web server logs for this morning from midnight to 9am, there were 15 potential attacks and there were also 39 the day before, so there’s a lot of potential data there if we started putting it all together. It’s all just information theory.

Night Tube Jubilee Line

Stacked area chart showing the number of tubes running on the Central, Jubilee and Victoria lines only.
Stacked area chart showing the number of tubes running on the Central, Jubilee and Victoria lines only. The data shows Thursday 6th October, Friday, Saturday and Sunday.

Just to follow up on the last post about the launch of the “Night Tube”, the service launched on the Jubilee Line last Friday. There are now close to 40 tubes running over night at the weekend on the Central, Victoria and Jubilee lines. The chart above shows the number of tubes running on Thursday 6th October through to 23:57 on Sunday night. The morning and evening peak rush hours are evident for Thursday and Friday, then the first Jubilee Line night services can be seen in the trough between Friday and Saturday.

The interesting thing to do now would be to run a public transport accessibility analysis using the real-time running data to see which parts of the city are now more connected. As today is the second day of the Southern Rail strike, that might make another interesting subject. Using the Census travel to work data we could forecast the areas where people are going to be late for work because of transport failures. That could potentially give a measure of what effect any strikes, or even just “congestion” generally, is having on London.

On a technical level, one thing which is now becoming apparent is that the number of drop-outs from the API has increased. It used to be that there would be a few per day on the Northern Line (biggest data), but now they seem to be occurring randomly across all the lines. The CASA API has been collecting data since the London Olympics in 2012, so it’s long overdue for some maintenance.

Night Tube Launches

NightTubes_20160822
Stacked area chart showing total number of tubes running on all lines from midnight on Thursday 18th August through to midnight on the following Monday morning.

The first night tubes started running last Friday evening, so I couldn’t help wondering what that does to the number of tubes running. The graph above shows the total number of tubes running from Thursday 18th to Sunday 22nd August. My first reaction was, “what night service”, but then I read the TfL statement and realised that this is only the Central and Victoria lines with the rest to follow in the Autumn. The arrows on the diagram above show where the extra services show up in the statistics.

The following graph of only the Central and Victoria lines shows it a lot better:

NightTubes_20160822_CV
Stacked area chart showing the number of tubes running on the Central and Victoria lines only.

The total of around 20 tubes running through the night, with a total capacity of around 800 passengers each (TfL Rolling Stock) is a significant extra capacity. It’s just that the peak rush hour service is so much bigger by comparison. I also wonder whether they were testing the Central line on the Thursday evening because of the large number showing up there over night? Normally we get a small residual number of tubes moving during the shutdown period which I’ve always put down to engineering services.

What is going to be interesting is to see how the service adapts to usage over time.

Now That’s What You Call a Tube Strike

Number of tubes running on the London Underground at 08:30 on 9th July 2015
Number of tubes running on the London Underground at 08:30am on 9th July 2015. The time scale runs from 4pm on Wednesday 8th until 08:30am on Thursday 9th.

The graphic says it all really. The width of the stream graph shows the total number of tubes running, with a breakdown by each tube line displayed in the regular line colour (red=Central Line, green=District Line etc).

Basically, there’s nothing running, apart from a “special service” on the Waterloo and City line. I’ve never seen it like this before, as, in the previous strikes, they’ve always managed to run about a 30% service.

Despite being told that everything was going to shut down completely by 6pm last night, it appears that the shut down began around 6pm and wasn’t complete until just after 9pm, although I wouldn’t like to have been trying to get home during that time. From the pictures on the news last night it looked like complete chaos, which just goes to reinforce the fact that we need to establish a method for measuring how many people the tube network is carrying (i.e. the “crush factor”).

Bus Networks and Other Complicated Data

As part of my PhD I’ve been looking at a lot of real-time data about tubes, buses and trains. In fact, I probably started from the point where I already had a lot of data and was wondering what to do with it. While I would not class this as “Big Data”, the complex nature and real-time element make it difficult to analyse and visualise.

21,987 bus stops (blue cubes), 53,896 links (white lines) and the Greenwich Meridian (bright green line).

The image above shows the bus network displayed using my virtual Earth viewer. Having previously done a lot of work on the tube network, it only took about half a day’s work to get the buses into the system. One reason for this is that I’ve implemented an agent based modelling system (ABM) similar to NetLogo, so I just have to write the code to load agents and links from CSV files (easy!). The simulation is a bit harder to do, but not much.

Although I knew the bus data was about 10 times bigger than the tube data, what I hadn’t bargained for was the fact that there are 21,987 bus stops (agent nodes), 53,896 route points (links) and up to 7,000 live buses (moving agents). The other weird thing is that TfL seem to be missing 409 bus stops from their master list as there are stops contained in the routes that I don’t have positions for. There are also a lot of invalid lines in the data that look as if there has been an error extracting the data from a database. I had a really interesting discussion with last Thursday’s visitor about that fact because he couldn’t believe it. I think I’m right in saying that there is a theory about complexity that goes along the lines of “any sufficiently complex data analysed deeply enough will always show inconsistencies”? In other words, we just have to deal with it.

Putting in some buildings gives a much better appreciation of just how big:

GeoGLBus_20150511_205417
Some buildings, a river and lots of bus stops.

If you look closely, you can just see the bus stops in the river which are pontoons for the boats. The coloured cubes representing the stops are all 100m on each axis. It now all gets worse, because that graph containing 53,896 route points has to be fragmented using the road network and a routing algorithm to make the buses travel along the roads or rivers. I’ll have to implement this just as soon as I get the data displaying at a reasonable frame rate.

To really put things into the correct scale, and thinking of the highways agency’s UK wide road network, which is on my list:

GeoGLBus_20150510_191155
You are here.

I just like the Winter Blue Marble image, which you don’t see very often. The Google Earth images are all the Blue Marble composite.

So, getting back to the PhD topic, which is about the algorithms which make all of this work, I obviously need to improve the graphics a lot, but most of the building blocks are now in place. I’m a graphics programmer, so the graphics engine is obviously hacked to pieces and I need to tidy it up. All the numbers in the top left of the images are the frame rates, which should be a lot higher than about 4-6 frames per second. If you take the geometry representing the bus routes (links), it’s a mesh with over 6 million points, and it’s taxing my graphics card a bit. Top of the range GPUs these days will do over a teraflop, which used to be supercomputing territory not long ago, but use them in 64 bit mode and the performance drops drastically. I still have some shader tricks to use which will improve the ABM performance a huge amount.

Finally, I have to answer the question, “what’s the point of it all?”. I wanted to analyse real-time dynamic data using a system that allowed me to explore the data visually in both time and space. Why is there a bus route from NW London going diagonally across to the SE in the first image? You can just see the white line going through the buildings, but it looks like an error in the data. Programming the model to simulate the buses allows you to explore the real-time element, but the aim is to have more in the way of analysis and data-mining than the simple widgets you get with NetLogo.

Now I have two networks, my first question is to look at how they compare to each other. I have the whole of 2014 to use for the analysis and a tool which (might) now let me do it.

Number of buses running.
Number of tubes running.

I’ve always wondered whether the peaks in the bus, tube and train numbers occur at the same times and whether there is any spatial variation?

Just as an update, here’s a movie I uploaded which shows  the bus network much better than any words can:


Ten Car Trains

I had a pleasant surprise on my commute home last night when I found myself on one of the new ten car trains that southwest trains have bought. They’ve coupled two brand new cars onto the front of their existing stock, so we could all see it was a new train as it approached the platform. Being able to get a seat was also a new experience.

Now, in transport modelling terms, that means that they have potentially increased their people carrying capacity by 25%. If they were running 8 car trains before and can now run 10 car trains, that’s a significant increase.

What I don’t know is how many of these trains they’ve got and when and where they’re running them. I’ve looked at the Network Rail data feed, but it doesn’t give you the size of the train. I need to look into the data a bit more deeply as there might be a physical train identifier that I’ve missed. They all have “leading car id”, but I can’t find this in the data feed. Even a map of all the stations that have been converted to take 10 cars would be interesting.

Happy Birthday MapTube!

Today is exactly 7 years since MapTube was launched at the “Digital Geography in a Web 2.0 World” conference at the Barbican in London as part of the GeoVUE project.MapTubeBirthday7

To mark the event I’ve added a new feature to the homepage which should make it more dynamic. Now, if I blog about any maps, they will automatically appear on the MapTube front page with the text, images and map links extracted directly from the RSS feed. Along with the ‘topicality index’, which places maps for data which is currently in the media on the front page, this should keep the website up to date with the latest events. It’s also telling me what information we don’t currently have so we can gradually fill the gaps in our knowledge.

I’m hoping to follow this up in the next month with some real-time data feeds and more interactivity on the maps.

Links:

http://www.casa.ucl.ac.uk/barbican/presentation6.html

http://www.casa.ucl.ac.uk/barbican/

http://www.casa.ucl.ac.uk/news/newsStory.asp?ID=122

Bus Strike January 13th 2015 (Update)

Just for completeness, I’ve updated the two graphs of the numbers of buses running on 13th January with the complete set of data up to 23:59 that night.

Numbers of buses running the 13th (strike) against the previous day
Ratio of number of buses running on the 13th (strike) to the previous day

The first graph shows the total number of buses running on Tuesday 13th (red) against the previous day (blue). The second graph shows the ratio of red/blue*100%, or what percentage of a normal day’s buses were running? It levels off at around 24% quite definitely and never reaches the 33% which is the official TfL figure for the percentage of services running. The mean value for 7am to midnight works out as 23.7%, so either TfL have a different way of calculating the figure, or our data is wrong. This is something I’ve been wondering about for a while now, as we assume the data from the TfL Countdown API is accurate, but have no independent cross check. Coding errors can also lead to data issues and we know that during the last tube strike lots of extra buses ran which didn’t have the “iBus” tracker on them and so didn’t show up on our data. Having said that, there is nothing to suggest a problem with the data.

One other thing I was wondering about was what effect the strike would have on tube overcrowding? Having seen a news report from Vauxhall bus garage the previous day, I realised the huge number of people this was going to affect. If you’re a commuter changing trains at Vauxhall, then your logic goes something like this:

1. “There is a bus strike, so everybody who normally catches a bus from there is going to try to get on the tube. The tube will be packed.”

2. “There is a bus strike, so the delivery of people by bus to the tube station will be much lower than normal. The tube will be empty.”

It’s all a question of numbers, but, at the moment,  it’s not something which have the data to even attempt to answer. But, by collecting data about unusual events like this, it might give us the insights into what happens on a normal day.