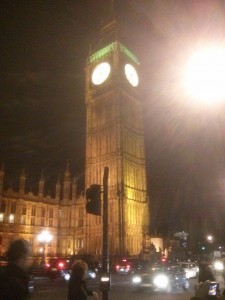
Today I’ve been attending the Parliamentary Office of Science and Technology (POST) seminar on Big Data after being interviewed by Stephen Hanley for the “Big and Open Data in Transport” POST Note back in July. It wasn’t held in the main Parliament building, but just around the corner from here:
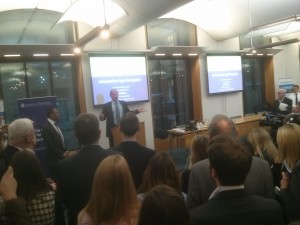
The first part of the seminar was a panel session discussing Big Data generally. The session was introduced by Adam Afriyie MP and chaired by Chris Tyler from POST. The panel was formed of Prof. Amanda Chessell (IBM), Prof. Carol Dezateux (UCL), Chris Fleming (Government Office for Science), Christopher Graham (Information Commissioner), Dr. Susan Grant-Muller (Leeds), Carl Miller (Centre for Analysis of Social Media), Matthew Rice (Privacy International), Dr. Emma Uprichard (Warwick).
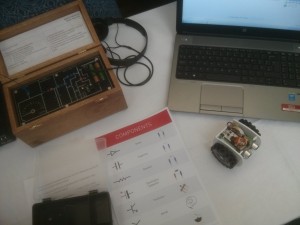
After the Big Data session, there was a reception for the new “Information Age” exhibition at the Science Museum which launched a couple of weeks ago. Aside from Claude Shannon making an appearance, they had an analogue radio that you made work by connecting the components with wires, two robots that you could program via a “scratch” type web interface, plus a lot of old computer and communications hardware (Apple Newton!).
The cute little robots are Arduino based with 3D printed bodies from an ABS printer rather than the PLA that we’re using with both our CASA MakerBots. In the picture you can also see the radio housed in the wooden box in the top left. The Science Museum demonstrators were really interested in our experiments with the HexBugs Spiders and Leap Motion control. I think we really need to do some more with robots in the future, but the Science Museum ones were running off 4xAA batteries, not the coin cells we kept having to replace when we were at Leeds City Museum.
The best part was the presentation by Sir Tim Berners-Lee about the origins and future of the World Wide Web:
Afterwards, it was one of those moments when you really thought people would never stop clapping.
I also had an interesting conversation with Cubic Transportation Systems, the company that runs the UK Oystercard system. My initial question of, “how many people are there who use paper tickets and so get missed off the Oyster statistics”, had them wondering how to calculate it. The problem is that none of the data can actually give you this figure directly, and various estimates have been proposed. Aside from that, seeing their transport visualisation made me realise just how much real-time data we have in CASA and that we really should be doing more with it.
I’ve done nothing on real-time data since starting on Future Cities, so I decided to go back to the ANTS server and see if I could use the Network Rail data to answer the following Big Transport data question:
“If I pick any train at random in the UK, what is the probability that I pick a late running one?”
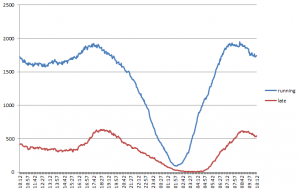
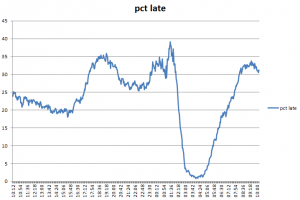
To cut a long story short, it’s about a 1 in 3 chance:
The two graphs show data for the number of running trains, the number of late trains and the percentage late for 10am on 5th November 2014 to 10am on 6th November 2014.
That’s one application of “Big and Open Data in Transport”, which is exactly what what the POST note was about.
Useful Links:
http://www.parliament.uk/mps-lords-and-offices/offices/bicameral/post/post-events/
And more on Hex Bug spiders:
http://www.geotalisman.org/2012/11/01/hex-bug-spiders-with-computer-vision/
http://www.geotalisman.org/2012/10/30/hacking-hex-bug-spiders/

